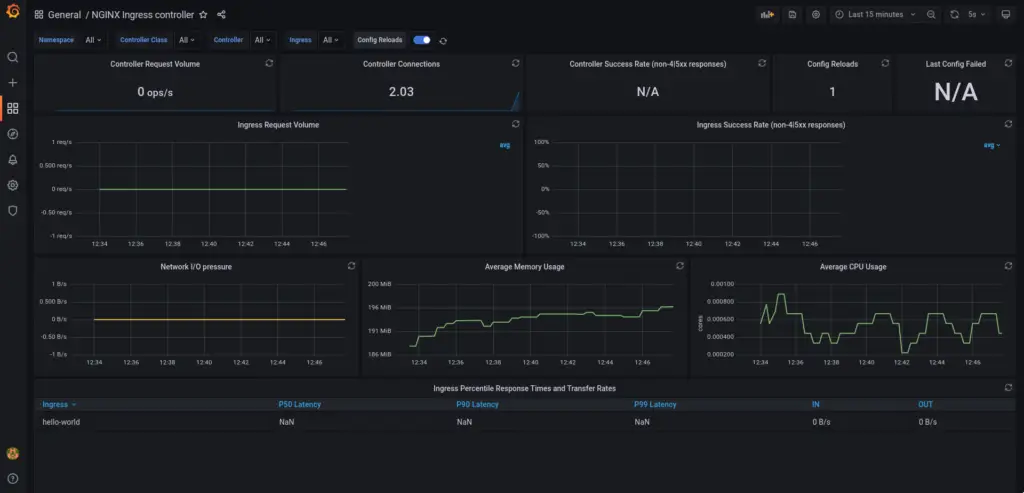
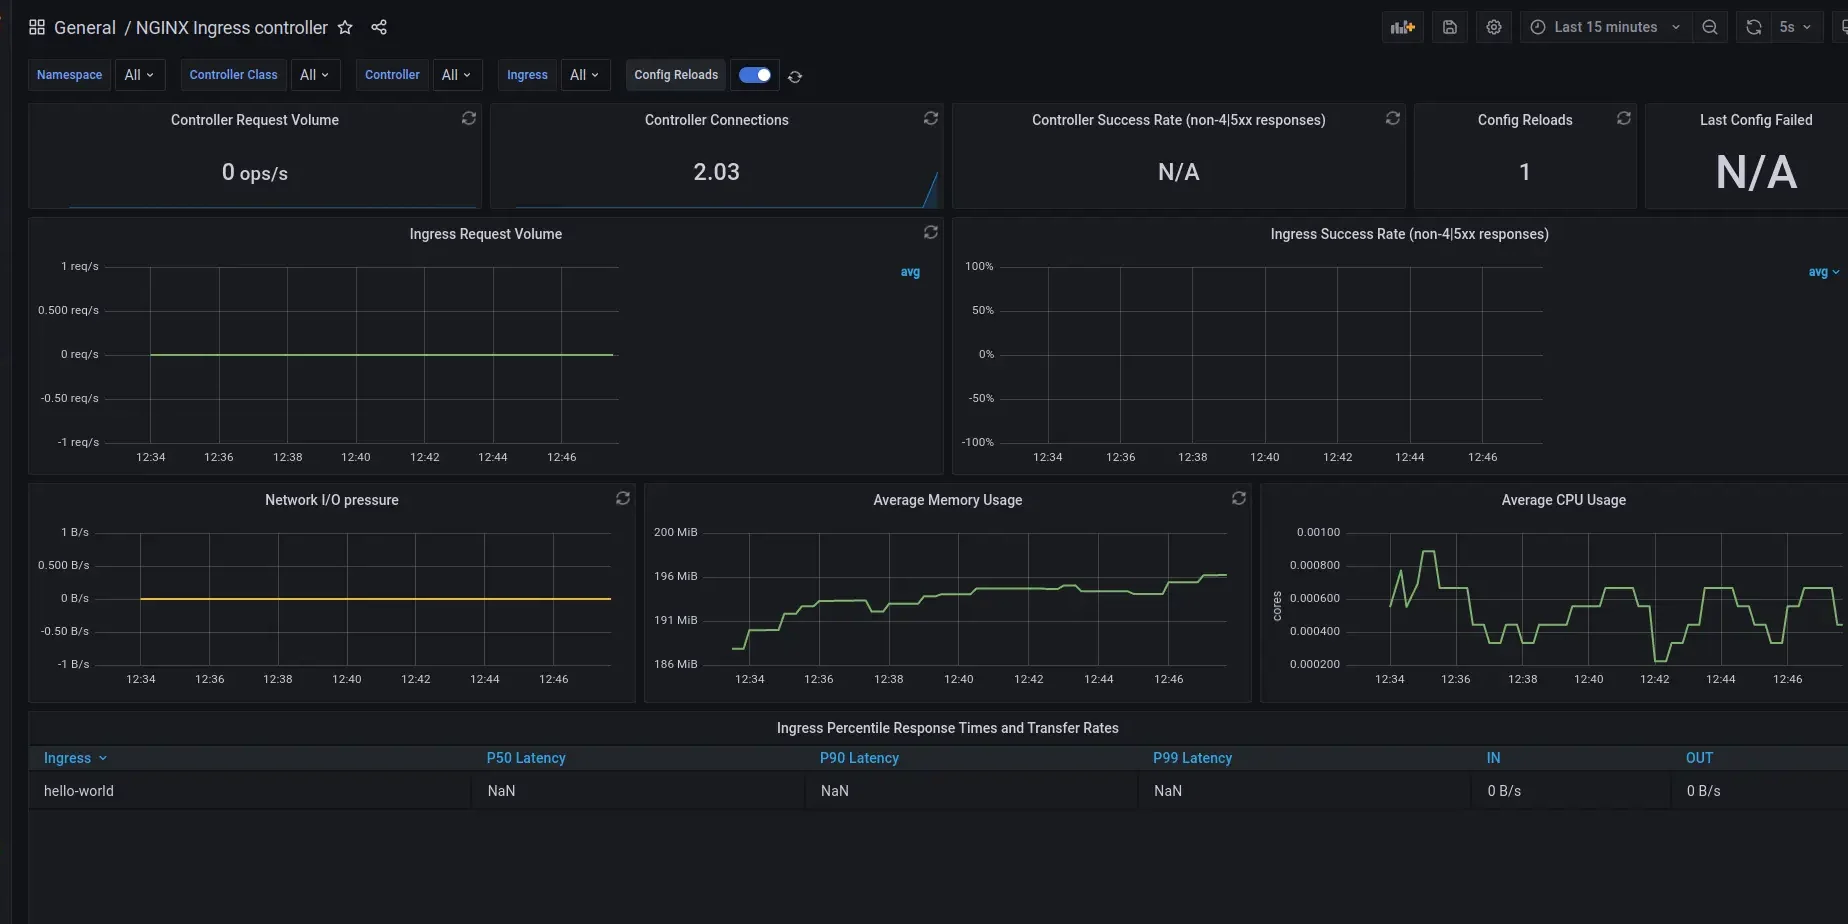
In my previous articles, I covered how to setup NGINX Ingress controller and a fully functional Prometheus & Grafana stack in Amazon EKS (Elastic Kubernetes Service). In this article, we will leverage the knowledge from the articles to understand how to monitor NGINX Ingress controller setup for metrics like Number of requests, response time, response errors, latency and others. The approach will involve deploying a PodMonitor to monitor the metrics emitted by NGINX ingress controller pods and pre-built dashboards to view the outcome in Grafana.
Prerequisites
- An EKS cluster
- NGINX ingress controller with sample application deployed (Refer here)
- Prometheus stack deployed (Refer here)
Understanding Prometheus scraping
Prometheus Operator monitors CRDs like PodMonitor & ServiceMonitor to discover targets to fetch the metrics. These resources can be defined in a Kubernetes native manner using selectors with labels. The resources also contain the further details of how to scrape a certain target, the port and path to be scraped and interval of scraping. A sample ServiceMonitor can be viewed using the command:
kubectl describe servicemonitor prometheus-kube-state-metricsThis service monitor alongwith others are created as part of the kube-prometheus-stack. In case of NGINX ingress controller monitoring, we need to monitor the pods of Ingress controller. To do so, we need to create a PodMonitor. Here is a sample of PodMonitor
apiVersion: monitoring.coreos.com/v1
kind: PodMonitor
metadata:
  name: example-app
  labels:
    team: frontend
spec:
  selector:
    matchLabels:
      app: example-app
  podMetricsEndpoints:
  - port: web
Pod Monitor – How does it work?
Prometheus operator watches for these custom resources and keeps updating its configuration constantly. As it can be seen, a Pod Monitor scans for pods using label matchers. podMetricsEndpoints array is used to specify details of the port, scrape path, authorisation and others details. A single PodMonitor can scan multiple pod endpoints as well as multiple pods using label matchers. Prometheus identifies and scrapes each pod individually and aggregates the metrics from them.
Configuring metrics in NGINX Ingress controller
NGINX ingress controller doesn’t record/emit metrics in the default setup. In order to enable Prometheus metrics, follow the below steps:
Edit Deployment
kubectl edit deployment ingress-nginx-controller -n ingress-nginxAdd Annotations
Add the below annotations to guide prometheus for scrape port and path. These attributes can be provided either in the PodMonitor or in the deployment itself.
  prometheus.io/port: "10254"
  prometheus.io/scheme: http
  prometheus.io/scrape: "true"
You will observe few more annotations already exist in the deployment – These are inserted by Kubernetes. You can leave them untouched.
Error in Documentation
The document at this link points to incorrect information that does not apply to the currently deployed stack – https://docs.nginx.com/nginx-ingress-controller/logging-and-monitoring/prometheus/
Enable Metrics in NGINX Ingress controller
Modify the pod startup command as shown below:
      containers:
      - args:
        - /nginx-ingress-controller
        - --publish-service=$(POD_NAMESPACE)/ingress-nginx-controller
        - --election-id=ingress-controller-leader
        - --controller-class=k8s.io/ingress-nginx
        - --configmap=$(POD_NAMESPACE)/ingress-nginx-controller
        - --validating-webhook=:8443
        - --validating-webhook-certificate=/usr/local/certificates/cert
        - --validating-webhook-key=/usr/local/certificates/key
        - --enable-metrics
The --enable-metrics flag enables the controller to expose an endpoint for Prometheus metrics. By default, these metrics are exposed on port 9113
Add the port to ports list
Add the below port for Prometheus to the port list.
        - containerPort: 10254
          name: prometheus
          protocol: TCP
Save the updated manifest and apply the changes.
Validating the metrics availability
Lookup the pod name for the nginx-ingress-controller deployment
kubectl get pods -n ingress-nginx Since the metrics are available on port 10254 – Let us perform port forwarding to the pod using the below command:
~$ kubectl port-forward ingress-nginx-controller-ddbff48fc-8szgq -n ingress-nginx 10254:10254
Forwarding from 127.0.0.1:10254 -> 10254
Forwarding from [::1]:10254 -> 10254
Once the forwarding is successfully established, open your browser and hit the URL – http://localhost:10254/metrics . You will observe a bunch of metrics listed in the browser. Here is a brief list of what I can see.
# HELP go_gc_duration_seconds A summary of the pause duration of garbage collection cycles.
# TYPE go_gc_duration_seconds summary
go_gc_duration_seconds{quantile="0"} 4.9164e-05
go_gc_duration_seconds{quantile="0.25"} 6.1474e-05
go_gc_duration_seconds{quantile="0.5"} 6.6401e-05
go_gc_duration_seconds{quantile="0.75"} 9.1132e-05
go_gc_duration_seconds{quantile="1"} 0.009038346
go_gc_duration_seconds_sum 0.009865786
go_gc_duration_seconds_count 10
# HELP go_goroutines Number of goroutines that currently exist.
# TYPE go_goroutines gauge
go_goroutines 98
# HELP go_info Information about the Go environment.
# TYPE go_info gauge
go_info{version="go1.17.6"} 1
# HELP go_memstats_alloc_bytes Number of bytes allocated and still in use.
# TYPE go_memstats_alloc_bytes gauge
go_memstats_alloc_bytes 6.10552e+06
# HELP go_memstats_alloc_bytes_total Total number of bytes allocated, even if freed.
# TYPE go_memstats_alloc_bytes_total counter
go_memstats_alloc_bytes_total 3.9180632e+07
# HELP go_memstats_buck_hash_sys_bytes Number of bytes used by the profiling bucket hash table.
# TYPE go_memstats_buck_hash_sys_bytes gauge
go_memstats_buck_hash_sys_bytes 1.460927e+06
# HELP go_memstats_frees_total Total number of frees.
# TYPE go_memstats_frees_total counter
go_memstats_frees_total 188488
# HELP go_memstats_gc_cpu_fraction The fraction of this program's available CPU time used by the GC since the program started.
# TYPE go_memstats_gc_cpu_fraction gauge
go_memstats_gc_cpu_fraction 0.0016377213476737936
# HELP go_memstats_gc_sys_bytes Number of bytes used for garbage collection system metadata.
# TYPE go_memstats_gc_sys_bytes gauge
go_memstats_gc_sys_bytes 5.822016e+06
# HELP go_memstats_heap_alloc_bytes Number of heap bytes allocated and still in use.
# TYPE go_memstats_heap_alloc_bytes gauge
go_memstats_heap_alloc_bytes 6.10552e+06
Configuring Pod Monitor
With the above changes, we now have metrics working for the Ingress controller. Configuring the PodMonitor actually has two steps involved:
- Create the pod monitor to scrape the metrics from ingress controller pods
- Enable scanning for the pod monitor itself.
Creating pod monitor for ingress controller
Create a file named podmonitor.yaml with the content below:
apiVersion: monitoring.coreos.com/v1
kind: PodMonitor
metadata:
  name: prometheus-ingress-nginx-controller
  labels:
    app: prometheus
spec:
  selector:
    matchLabels:
      app.kubernetes.io/component: controller
      app.kubernetes.io/instance: ingress-nginx
  podMetricsEndpoints:
  - port: prometheus
    path: /metrics
Notice here that there is a label app: prometheus provided to the monitor and matchLabels has the nginx-ingress-controller specific label. The app: prometheus label is used to tell Prometheus operator to scan the pod monitor. This facility is provided to limit the scanning radius thereby improving the performance.
Configure scanning for the pod monitor
The deployed stack by default scans for PodMonitors with label release: prometheus in its own namespace. However, we would prefer to have app:prometheus as the base for finding the pod monitors. This configuration is stored in a CRD called Prometheus.
Let us edit the existing custom resource to modify the label. To do so, run the below command:
kubectl edit prometheus prometheus-kube-prometheus-prometheusFind the below lines:
  podMonitorSelector:
    matchLabels:
      release: prometheus
and change it to
  podMonitorSelector:
    matchLabels:
      app: prometheus
Apply the change. Internally, prometheus operator monitoring the configuration and automatically reloads the pod to reflect the changes.
Visualising the metrics
We are all set ! Let us now view the metrics. To do so, perform a Port-forward to Grafana using the below command:
$ kubectl port-forward prometheus-grafana-bd4cd5b9f-jldb7 3000:3000Open Grafana in the browser using the URL: http://localhost:3000 – and login using the default username and password (admin/prom-operator).
Head over to the URL: http://localhost:3000/dashboards and click Import. Grafana provides a bunch of pre-built dashboards from the community to easily visualise the metrics. To import the NGINX ingress controller dashboard, enter the ID 9614 in the import text box and click load. Continue with the default.
Once imported, you should be able to view a dashboard as shown below. Send some traffic to the example application to observe the change in metrics based on requests.

Conclusion
This elaborate article talked about how to configure PodMonitor for NGINX ingress controller to monitor the metrics in an easy manner. Prometheus operator simplifies a lot of intricacies by providing Cloud native way of doing things. You should now be able to practically monitor any application pods for your Kubernetes cluster and send out metrics to Prometheus and visualise in Grafana using the Prometheus Datasource.


