Observability Consulting: Grafana, Prometheus & OpenTelemetry
Dashboards are not observability. I design telemetry pipelines that answer real questions: metrics, logs and traces tied to SLOs that people act on.
What I help with
- Open-source stacks built on Grafana, Prometheus, the OpenTelemetry Collector, Loki and Tempo
- Migration from commercial vendors such as Datadog to open-source tooling
- Distributed tracing and trace sampling strategy
- Kubernetes and NGINX ingress monitoring
- SLO and service-health tracking
- Instrumentation for large self-hosted platforms
Relevant experience
- Built, deployed and operated a 30M+ active-series observability stack on open source at Twilio Segment
- Migrated observability from Datadog to open-source tooling
- Manage observability instrumentation for large-scale self-hosted GitHub and Artifactory
- Improved the observability landscape for better SLO tracking of services
- Write publicly about OpenTelemetry, Jaeger tracing and Kubernetes monitoring
Related articles
The beginner’s guide to Observability
The article tries to capture the keywords used on a daily basis, explains the significance of each task done as part of observability and puts forth the challenges that exist in the industry today around observability.
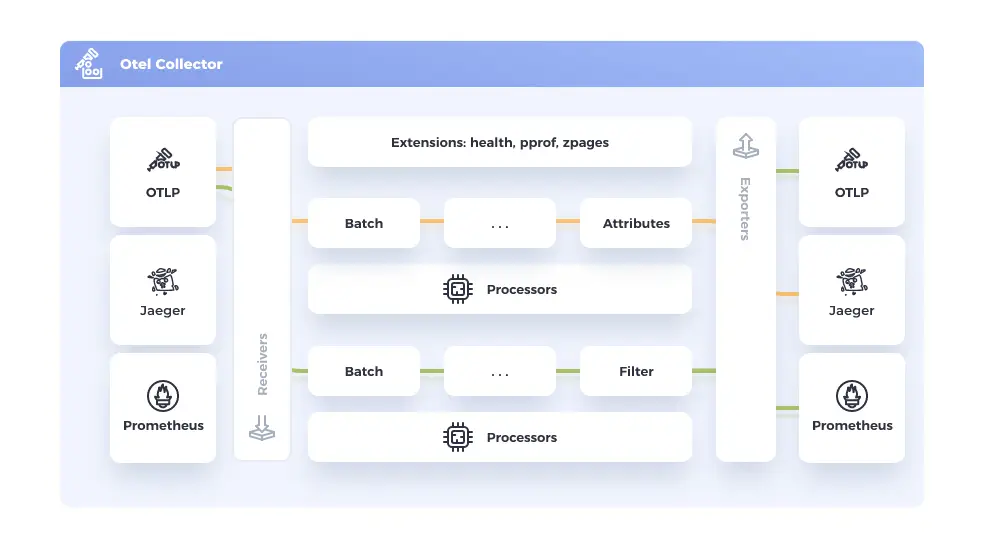
Exploring the Power of Observability with OpenTelemetry Collector
Introduction In today’s fast-paced and dynamic digital landscape, ensuring the performance and reliability of software applications is paramount. Enter OpenTelemetry Collector, a powerful tool designed to enhance observa

Unveiling the Power of OpenTelemetry Operator: Simplifying Observability in Kubernetes
Introduction In the ever-evolving landscape of cloud-native applications, observability is paramount for understanding and optimizing system performance. OpenTelemetry Operator emerges as a key player in this realm, seam
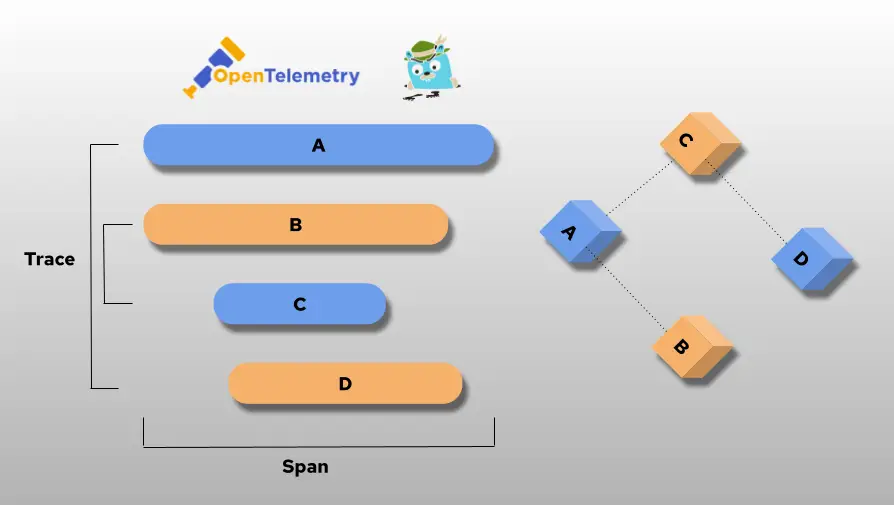
A Comprehensive Guide to Trace Sampling Strategies in Distributed Tracing
Introduction In the dynamic world of distributed systems, gaining insights into application performance often relies on effective trace sampling strategies. Distributed tracing provides a holistic view of transactions ac
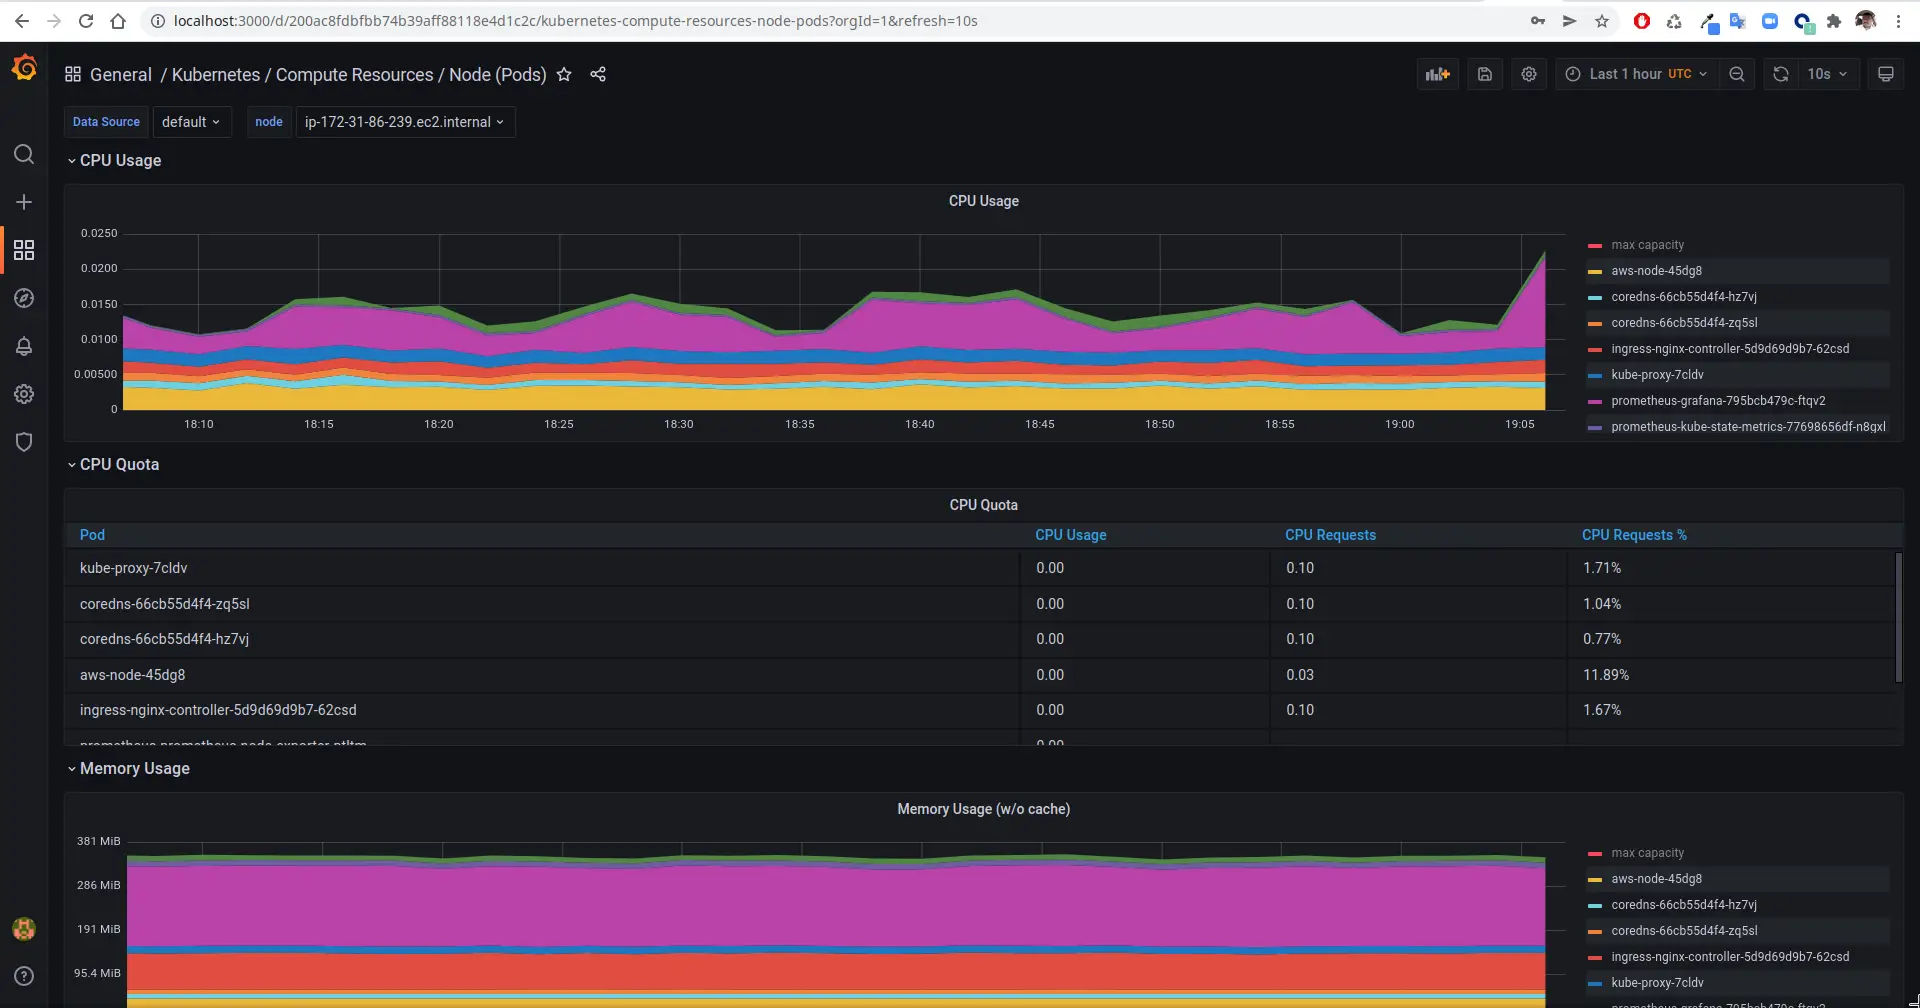
Setup Kubernetes cluster monitoring the easy way
Monitoring is the key to meeting the SLO for any production deployments. With Kubernetes Cluster taking over a lot of production deployment workload these days, there has been a lot of development in the monitoring space
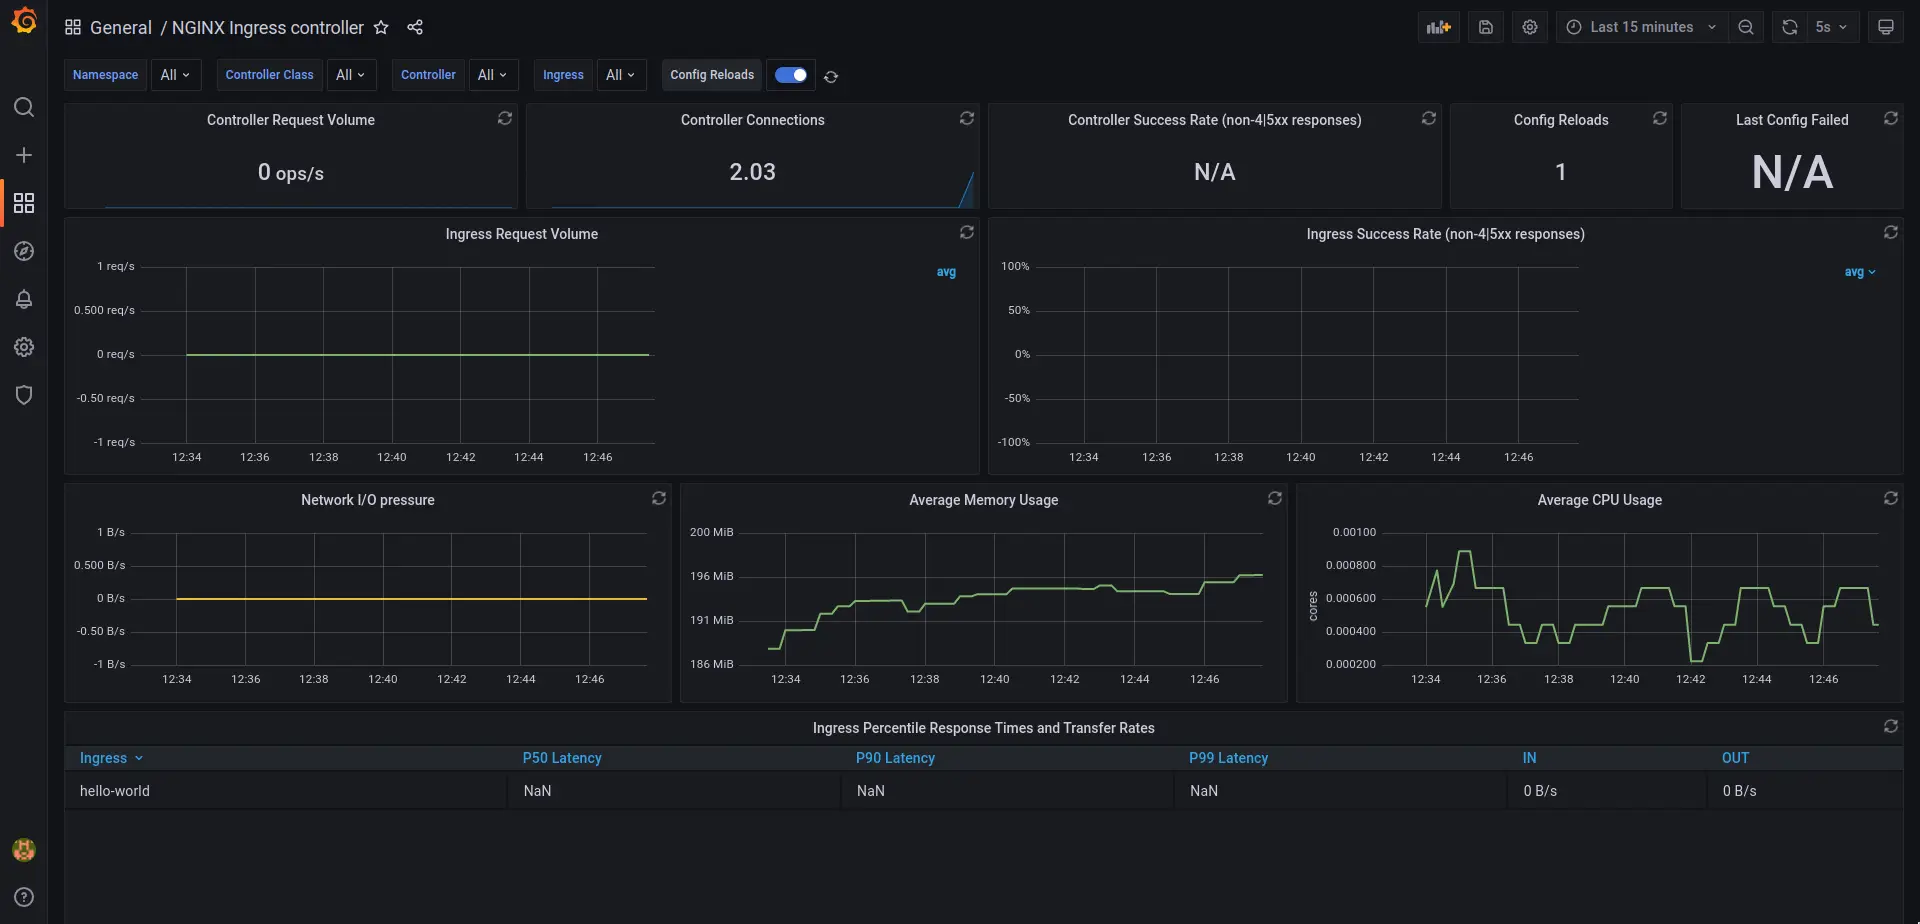
Monitoring NGINX Ingress Controller using Open-source tools
In my previous articles, I covered how to setup NGINX Ingress controller and a fully functional Prometheus & Grafana stack in Amazon EKS (Elastic Kubernetes Service). In this article, we will leverage the knowledge from