Monitoring is the key to meeting the SLO for any production deployments. With Kubernetes Cluster taking over a lot of production deployment workload these days, there has been a lot of development in the monitoring space for Kubernetes. In this article, we will perform a quick setup of complete monitoring stack using Helm charts initially. Once done, we will understand the stack in details to get an insight into what all does the helm chart really do. We will be using the latest Prometheus Cloud native way of defining the scrapers and monitors to successfully monitor our cluster.
Prerequisites
Before we get started, below are some prerequisites that need to be ready to follow the tutorial along.
- A working Kubernetes Cluster (AWS EKS will be used by me – but you can utilise any cloud provider or local setup)
- Install kubectl CLI
- Install Helm
- Atleast two Kubernetes nodes to be able to observe proper metrics per node
Installing the Prometheus Stack
The complete Prometheus-Grafana stack for Kubernetes is available as an open-source repository. To add the helm repo to your system, run the below command:
helm repo add prometheus-community https://prometheus-community.github.io/helm-charts
helm repo add stable https://charts.helm.sh/stable
helm repo update
Once the repo update is completed, we are good to proceed with the installation of the complete cluster monitoring stack. Run the below command to install the prometheus helm chart.
helm install prometheus prometheus-community/kube-prometheus-stackThis is it ! The complete Prometheus and Grafana setup is done ! Sounds shocking? Was that too quick? Let us test it for ourselves.
Testing the installation – Prometheus and Grafana
Let us start by checking the deployments –
kubectl describe deployment prometheus-grafana
kubectl describe deployment prometheus-kube-prometheus-operator
Above two commands will provide the details of Prometheus and Grafana deployments. Note the change in Prometheus naming – Prometheus Operator. Prometheus has shifted to a Cloud native way of defining and understanding the configuration to enable easier configuration deployments using standard kubectl utilities.
When observing the output of the above two commands, you will notice that Grafana is running on port 3000
   grafana:
    Image:       grafana/grafana:8.4.2
    Ports:       80/TCP, 3000/TCP
while Prometheus is running on port 10250
   kube-prometheus-stack:
    Image:      quay.io/prometheus-operator/prometheus-operator:v0.55.0
    Port:       10250/TCP
Thus, to access Prometheus and Grafana UI, we need to enable port-forwarding to the respective ports from local system. To do so, run the below commands in two different terminal sessions.
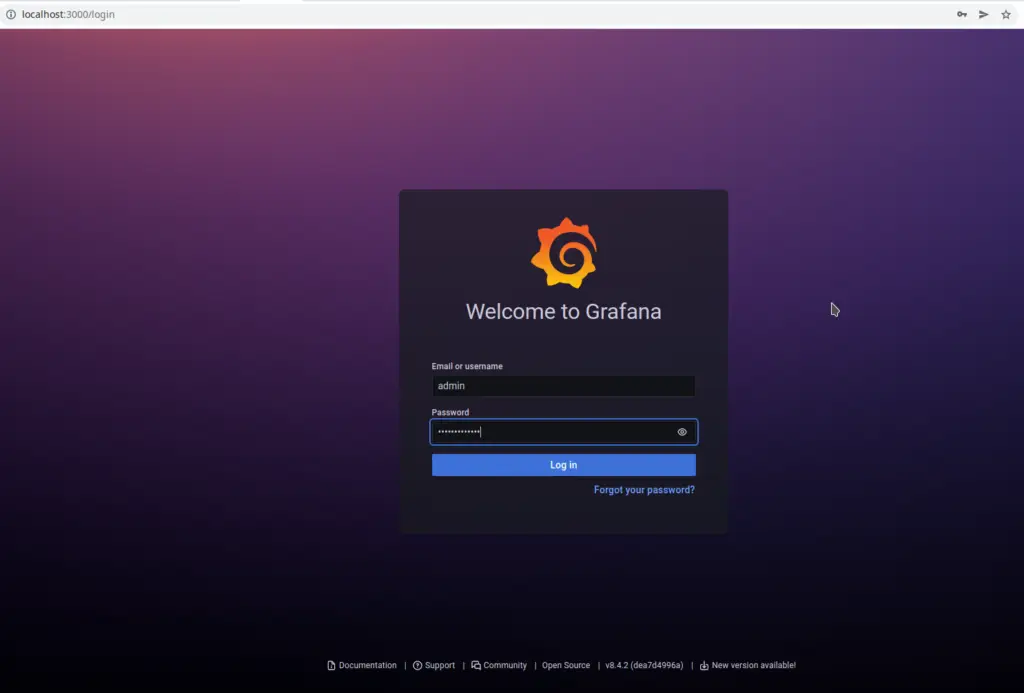
kubectl port-forward deployment/prometheus-grafana 3000Once the tunnel is active, hit the URL http://localhost:3000 to land on the Grafana UI. The username and password by default is admin and prom-operator respectively. The password can be changed during install by passing the value grafana.adminPassword=<your-password>.

Enter the login details to enter the Grafana admin UI. The good thing about this Helm chart installation is that it preinstalled the below components:
- Kube state metrics exporter
- Configuration to scrape Kube state metrics
- Pre-built Grafana dashboards as Cloud native configurations
- A sidecar container within Grafana deployment to preload the dashboards from the config map
- Prometheus
ServiceMonitor(to be discussed further in the article) - Prometheus datasource in Grafana using a sidecar and configmap
Above components collectively lead to Kubernetes node and pod metrics being exported to Prometheus and Prometheus added as datasource to Grafana. Thus, we should be able to browse the metrics from pre-built dashboards quite easily.
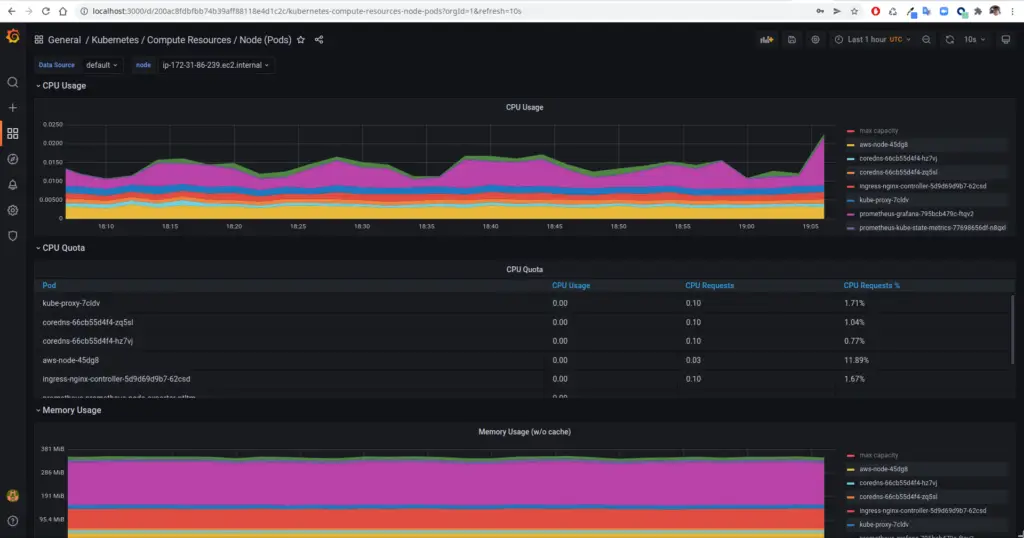
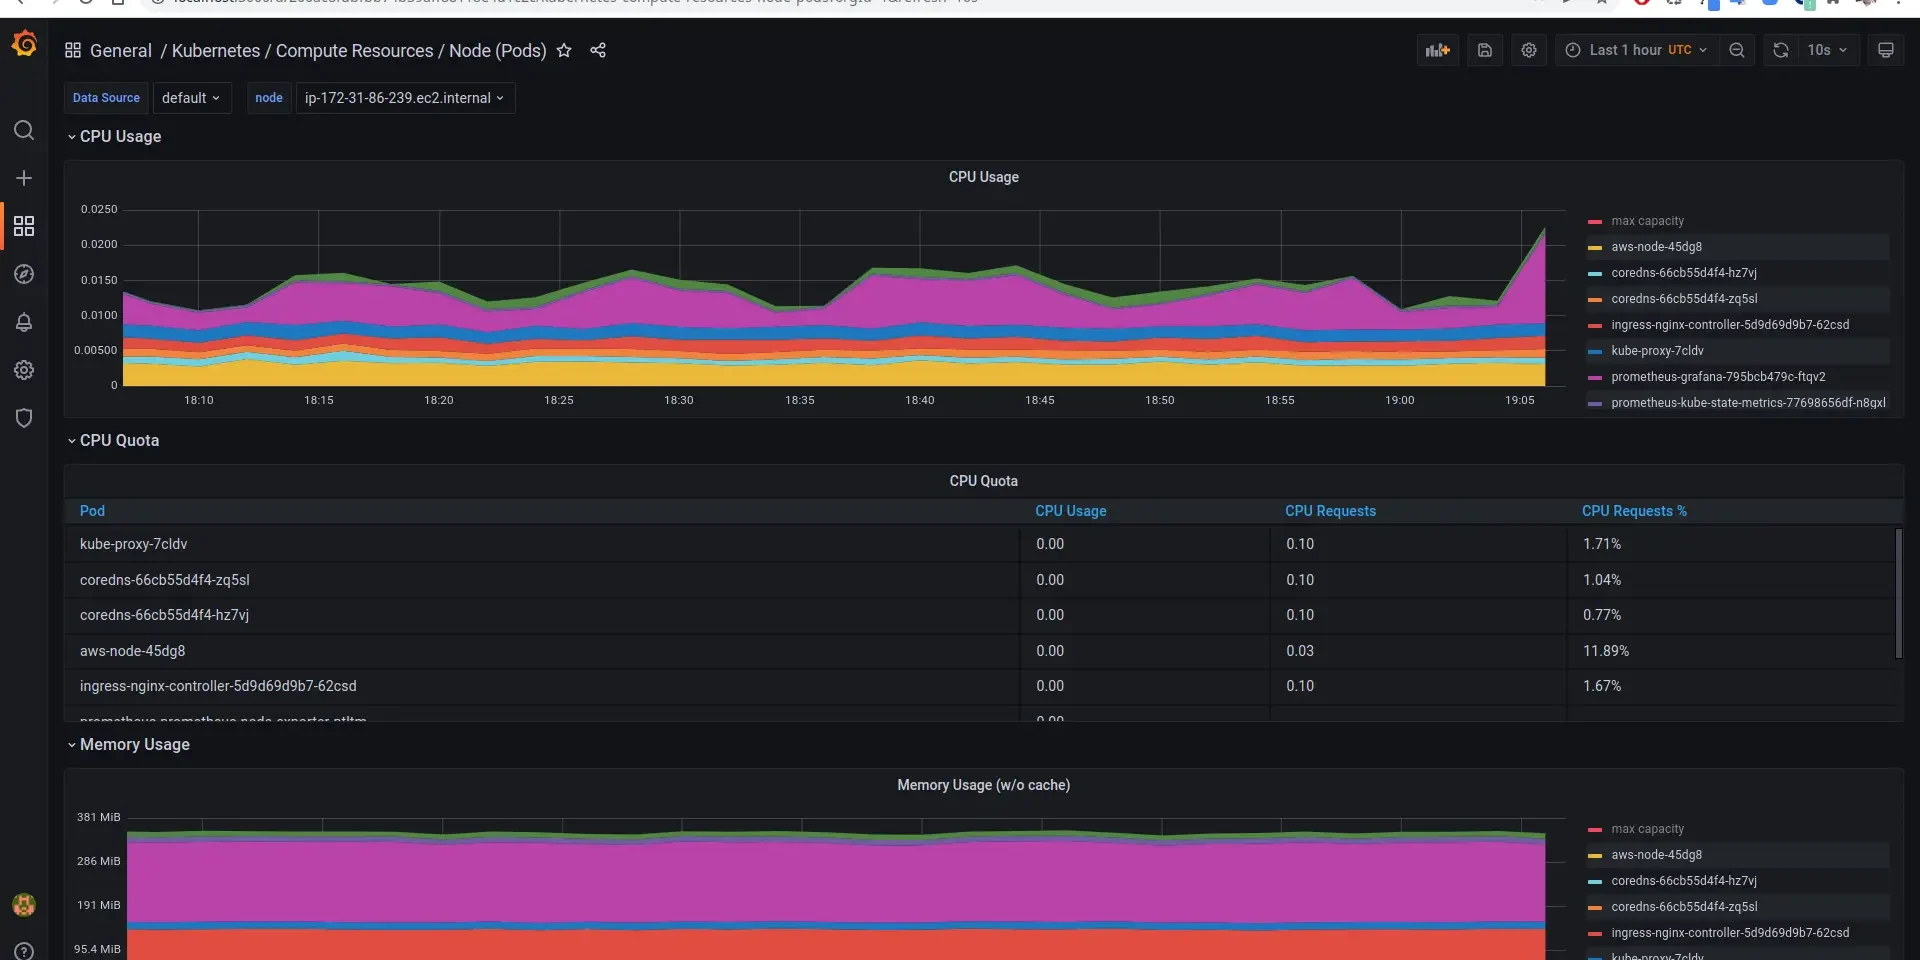
In the Grafana UI, navigate to Dashboards -> Browse -> Search (Kubernetes Compute Resource Node (Pods)). Click the dashboard in the search result to view the metrics of the various pods that are running. There are numerous such dashboards that have been pre-installed for you to explore. Take some time to explore and understand all that exists with this little effort. Here is a screenshot of how it looks for me.

Finally, once you have had the satisfaction of browsing through easily setup dashboards, we can jump into the difficult parts of how all this came together. In the further sections, we will understand the components that were deployed and brought together to make this entire thing possible.
Components of the Prometheus-Grafana stack
Helm is an excellent tool to quickly deploy complete stack of tools built by the experts. However, one of the major drawbacks is that it does not disclose what all it is going to deploy. When we wish to customise it, we need to rely on the documentation of the corresponding Helm chart. In our case, the helm chart we used is poorly documented. Thus, in this section, we try to list and understand each resource type that is created by the Helm chart.
Getting list of all resources
kubectl --namespace default get all -l "release=prometheus"Execute the above command to get the list of all resources deployed by the Helm stack. Now, let us go step by step and understand the purpose of each of these.
Deployments, Pods and Daemonsets
NAME READY STATUS RESTARTS AGE
pod/prometheus-grafana-795bcb479c-6mbcb 3/3 Running 0 110m
pod/prometheus-kube-prometheus-operator-667548975f-rtwz9 1/1 Running 0 27m
pod/prometheus-kube-state-metrics-77698656df-5qk98 1/1 Running 0 27m
pod/prometheus-prometheus-node-exporter-2zvwf 1/1 Running 0 27m
pod/prometheus-prometheus-node-exporter-hq7xk 1/1 Running 0 27m

NAME DESIRED CURRENT READY UP-TO-DATE AVAILABLE NODE SELECTOR AGE
daemonset.apps/prometheus-prometheus-node-exporter 2 2 2 2 2  27m

NAME READY UP-TO-DATE AVAILABLE AGE
deployment.apps/prometheus-grafana 1/1 1 1 110m
deployment.apps/prometheus-kube-prometheus-operator 1/1 1 1 27m
deployment.apps/prometheus-kube-state-metrics 1/1 1 1 27m
Deployment prometheus-kube-prometheus-operator: Cloud Native Prometheus is based on Prometheus Operator that scans through cloud native resources. The operator provides Prometheus backend interface to scrape metrics, accept pushed metrics and also provide utilities to load configurations. The deployment can be scaled horizontal in the form of replicas and shards unlike the previous plain old prometheus that didn’t support scaling.
Deployment prometheus-kube-state-metrics: The kube-state-metrics installation is responsible for collecting and providing the cluster metrics to Prometheus locally. A prometheus scrape configuration is created (discussed further) to define the URL and port to scrape.
Deployment prometheus-grafana: This deployment is responsible for providing the Grafana UI. It contains two sidecars alongside. The sidecars are responsible for auto-configuring prometheus datasource and pre-built dashboards for the Kubernetes cluster. These are the dashboards that we saw while browsing the Grafana UI above. These Datasources and Dashboards are configured in the form of ConfigMap. You can check these maps using the command:
kubectl --namespace default get configmaps -l "release=prometheus"The ConfigMap named prometheus-kube-prometheus-grafana-datasource is the one that is responsible for defining the Datasource.
Daemonset prometheus-prometheus-node-exporter: This Daemonset deploys on every node and gathers the metrics for every node. The kube-state-metrics deployment queries the metrics from these exporters and send the metrics to Node exporter.
Custom Resource Definitions
To get the list of custom resource definitions created by the Helm install, run the below command:
% kubectl --namespace default get crds
NAME                                         CREATED AT
alertmanagerconfigs.monitoring.coreos.com    2022-03-21T09:55:29Z
alertmanagers.monitoring.coreos.com          2022-03-21T09:55:31Z
podmonitors.monitoring.coreos.com            2022-03-21T09:55:32Z
probes.monitoring.coreos.com                 2022-03-21T09:55:33Z
prometheuses.monitoring.coreos.com           2022-03-21T09:55:35Z
prometheusrules.monitoring.coreos.com        2022-03-21T09:55:36Z
servicemonitors.monitoring.coreos.com        2022-03-21T09:55:37Z
thanosrulers.monitoring.coreos.com           2022-03-21T09:55:39Z
Note: You might see a few extra CRDs in the list depending on your namespace and cloud provider. We will discuss only the ones related to Prometheus
These CRDs are created as part of the Helm stack. They make it possible to configure Prometheus and Grafana in a cloud native manner. Let us briefly understand the purpose of each CRDs.
alertmanagerconfigs: Configuration for the alerts using YAML config
alertmanager: Configuration for alert manager service
podmonitors: Configuration to monitor/scrape a specific pod for metrics. The pod monitor are queried from the cluster using the configuration podSelector provided in the Prometheus CRD
probes: Used to specify method to monitor group of ingresses or static targets deployed onto the cluster
prometheuses: Plural for Prometheus config resource. It is used to configure the Promtheus system setting including how to look for monitors, how to scrape data, certain default settings for the Prometheus instances and so on
prometheusrules: Rules to generate alerts in Prometheus. This can be used in absence of Alert Manager configuration
servicemonitors: This type of resource is used to monitor services collectively. The monitor configures an endpoint to scrape via service instead of pod directly
thanosrulers: Used to create resources that define Thanos ruler configuration
Custom Resources
Let us now take a quick look at the custom resources that exist. They are self-explanatory by name – so I’ll avoid explaining them in detail. You can explore them more by using kubectl describe <resource-type> <resource-name> to know more about their content. Feel free to comment if something is not clear.
% kubectl get alertmanagers
NAME                                      VERSION   REPLICAS   AGE
prometheus-kube-prometheus-alertmanager   v0.24.0   1          12m

% kubectl get prometheusrules
NAME                                                              AGE
prometheus-kube-prometheus-alertmanager.rules                     12m
prometheus-kube-prometheus-config-reloaders                       12m
prometheus-kube-prometheus-etcd                                   12m
prometheus-kube-prometheus-general.rules                          12m
prometheus-kube-prometheus-k8s.rules                              12m
prometheus-kube-prometheus-kube-apiserver-availability.rules      12m
prometheus-kube-prometheus-kube-apiserver-slos                    12m
prometheus-kube-prometheus-kube-apiserver.rules                   12m
prometheus-kube-prometheus-kube-prometheus-general.rules          12m
prometheus-kube-prometheus-kube-prometheus-node-recording.rules   12m
prometheus-kube-prometheus-kube-scheduler.rules                   12m
prometheus-kube-prometheus-kube-state-metrics                     12m
prometheus-kube-prometheus-kubelet.rules                          12m
prometheus-kube-prometheus-kubernetes-apps                        12m
prometheus-kube-prometheus-kubernetes-resources                   12m
prometheus-kube-prometheus-kubernetes-storage                     12m
prometheus-kube-prometheus-kubernetes-system                      12m
prometheus-kube-prometheus-kubernetes-system-apiserver            12m
prometheus-kube-prometheus-kubernetes-system-controller-manager   12m
prometheus-kube-prometheus-kubernetes-system-kube-proxy           12m
prometheus-kube-prometheus-kubernetes-system-kubelet              12m
prometheus-kube-prometheus-kubernetes-system-scheduler            12m
prometheus-kube-prometheus-node-exporter                          12m
prometheus-kube-prometheus-node-exporter.rules                    12m
prometheus-kube-prometheus-node-network                           12m
prometheus-kube-prometheus-node.rules                             12m
prometheus-kube-prometheus-prometheus                             12m
prometheus-kube-prometheus-prometheus-operator                    12m

% kubectl get servicemonitors
NAME                                                 AGE
prometheus-grafana                                   12m
prometheus-kube-prometheus-alertmanager              12m
prometheus-kube-prometheus-apiserver                 12m
prometheus-kube-prometheus-coredns                   12m
prometheus-kube-prometheus-kube-controller-manager   12m
prometheus-kube-prometheus-kube-etcd                 12m
prometheus-kube-prometheus-kube-proxy                12m
prometheus-kube-prometheus-kube-scheduler            12m
prometheus-kube-prometheus-kubelet                   12m
prometheus-kube-prometheus-operator                  12m
prometheus-kube-prometheus-prometheus                12m
prometheus-kube-state-metrics                        12m
prometheus-prometheus-node-exporter                  12m
Only three custom resources are listed as the other CRDs have no resources created by default.
Config Maps
Finally, let us get a high level overview of how datasources and dashboards took place. There are sidecars running within Grafana deployment that take care of loading data from the ConfigMaps and configuring the same onto Grafana. You can find all the configmaps here. These configmap includes the Datasource configmap as well as a bunch of pre-built dashboards. There are a few other ConfigMaps that take care of configuring Prometheus and Alert manager in general. Let us take a look at the ConfigMap created using this stack.
% kubectl get configmaps -l "release=prometheus"
NAME                                                           DATA   AGE
prometheus-kube-prometheus-alertmanager-overview               1      22m
prometheus-kube-prometheus-apiserver                           1      22m
prometheus-kube-prometheus-cluster-total                       1      22m
prometheus-kube-prometheus-controller-manager                  1      22m
prometheus-kube-prometheus-etcd                                1      22m
prometheus-kube-prometheus-grafana-datasource                  1      22m
prometheus-kube-prometheus-grafana-overview                    1      22m
prometheus-kube-prometheus-k8s-coredns                         1      22m
prometheus-kube-prometheus-k8s-resources-cluster               1      22m
prometheus-kube-prometheus-k8s-resources-namespace             1      22m
prometheus-kube-prometheus-k8s-resources-node                  1      22m
prometheus-kube-prometheus-k8s-resources-pod                   1      22m
prometheus-kube-prometheus-k8s-resources-workload              1      22m
prometheus-kube-prometheus-k8s-resources-workloads-namespace   1      22m
prometheus-kube-prometheus-kubelet                             1      22m
prometheus-kube-prometheus-namespace-by-pod                    1      22m
prometheus-kube-prometheus-namespace-by-workload               1      22m
prometheus-kube-prometheus-node-cluster-rsrc-use               1      22m
prometheus-kube-prometheus-node-rsrc-use                       1      22m
prometheus-kube-prometheus-nodes                               1      22m
prometheus-kube-prometheus-persistentvolumesusage              1      22m
prometheus-kube-prometheus-pod-total                           1      22m
prometheus-kube-prometheus-prometheus                          1      22m
prometheus-kube-prometheus-proxy                               1      22m
prometheus-kube-prometheus-scheduler                           1      22m
prometheus-kube-prometheus-statefulset                         1      22m
prometheus-kube-prometheus-workload-total                      1      22m
Here prometheus-kube-prometheus-grafana-datasource Configmap is used to configure prometheus as a datasource. The sidecar grafana-sc-datasources in prometheus-grafana deployment consumes this Configmap and registers a datasource in Grafana. Majority of the other Configmaps are responsible for creation of dashboards. The dashboards are configured as JSON file content within the configmap. They are loaded into Grafana by grafana-sc-dashboard sidecar in the prometheus-grafana deployment
Conclusion
Wow! We are all setup with high level Kubernetes monitoring and all the configuration needed to start monitoring more pods and services! Helm makes it quite simple but its complicated without having the right understanding of what happens behind the scenes. This article captures the same in detail. With this, we understood the components that work together to make Cluster and application monitoring possible. In future article, we will try to use this stack to monitor NGINX ingress controller for incoming requests !


1 Comment