Introduction to NGINX & Jaeger Tracing
NGINX is a high-performance web server used widely across the industry to serve static files as well as act as a reverse proxy server & load balancer in several scenarios. NGINX is a C++ application built to provide high performance and support variety of programming languages and features by leveraging a plugin based architecture. When deploying an application behind NGINX, customers find it difficult to analyse the performance of their application. Moreover, tracing the requests sent by the user becomes equally tough. This is where Jaeger tracing comes into picture.
Jaeger is a tracing solution for large scale distributed systems. It makes it easy for users to trace the transactions in a distributed system and pinpoint the actual application at fault. With Jaeger tracing, you can get a complete request flow, the request-response latency and debug the time taken by each application. Jaeger provides client agents for majority of the programming languages. These clients are used to push the “spans” and “trace” to the Jaeger collector that further stores it for the UI. That said, when you use a third-party binary or an application where you cannot configure the agent, it is difficult to get the traces. This article covers the solution to this using NGINX as a reverse-proxy server.
NGINX as Reverse Proxy
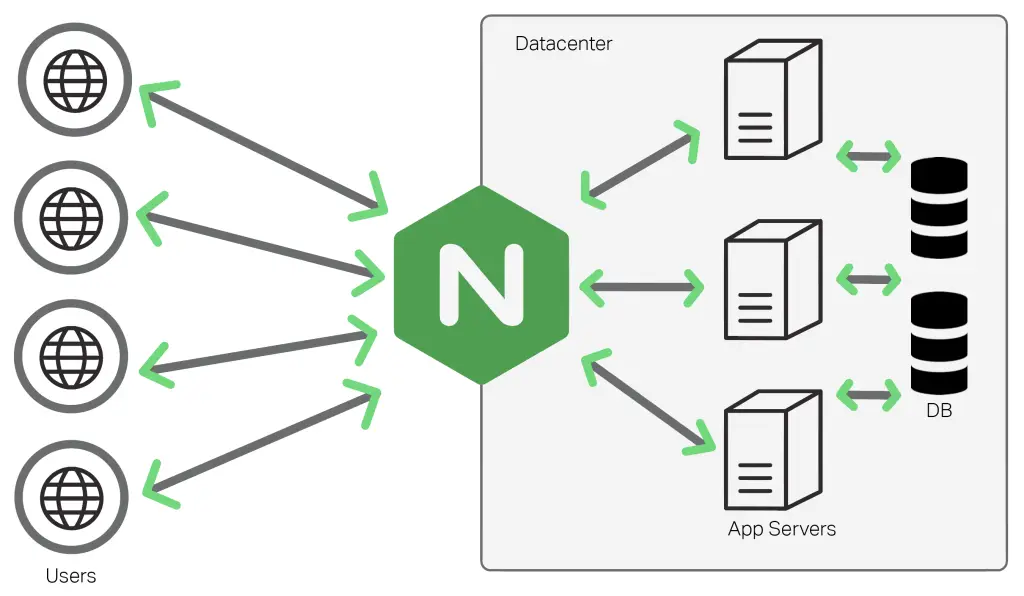
Reverse Proxy is a method of forwarding traffic to a different application running on the same or different server. For instance, consider a PHP application running using PHP-FPM or a GoLang binary providing APIs on a certain non-standard port. In this case, NGINX allows you to listen on the standard ports 80 and 443 – while forwarding the traffic to the applications on a different port. Additionally, it is also able to modify the request/response as needed to perform certain common actions liking adding security headers, enabling CORS and others.
Below image depicts this arrangement of NGINX as a reverse proxy.

NGINX Jaeger Tracing
NGINX has an excellent module and plugin based architecture that allows to extend the functionality and features of the web server. NGINX Open tracing module ngx_http_opentracing_module helps you to enable Open tracing features in NGINX. The module intercepts every request being received and proxy passed and sends the metrics to the Jaeger agent as thrift spans. The module requires a tracer and collector that can send and receive the traces. The tracer can be Jaeger or Zipkin tracers. In this tutorial, we try to cover implementation using Jaeger tracer.
Enabling Jaeger tracing in NGINX
The NGINX configuration file for enabling Jaeger tracing is shown below. Lets understand each step now.
Enabling the Open Tracing module
The first statement load_module modules/ngx_http_opentracing_module.so; helps in enabling the NGINX open tracing module. The module is not present by default. The instructions to install open tracing module can be found here.
load_module modules/ngx_http_opentracing_module.so;

events {}

http {
  opentracing on;

opentracing_load_tracer /usr/local/lib/libjaegertracing_plugin.so /etc/jaeger-config.json;
opentracing_tag bytes_sent $bytes_sent;
opentracing_tag request_time $request_time;
opentracing_tag upstream_addr $upstream_addr;

upstream pyapp{
server pythonapp:5000;
}

server {
    root /var/www;
    listen 8080;

    location / {
        opentracing_operation_name $uri;
        opentracing_propagate_context;
	proxy_pass http://pyapp;
}
  }
}
Enabling Open tracing using Jaeger plugin
The Open tracing module requires a specific Jaeger or Zipkin plugin in order to collect and send the traces out. In this tutorial, we utilise the Jaeger plugin. The Jaeger plugin can be easily download using the below command:
wget https://github.com/jaegertracing/jaeger-client-cpp/releases/download/v0.4.2/libjaegertracing_plugin.linux_amd64.so -O /usr/local/lib/libjaegertracing_plugin.soYou can find the latest releases here.
Configuring Tags for Open tracing
The next block of code configures the plugin, enables the open tracing and configures the tags to be sent out to the Jaeger agent. The variables being sent out are all standard NGINX variables available out of the box. You can add more variables to the trace by adding the statement opentracing_tag tag_name variable_name.
The Jaeger configuration file looks as shown below:
{
  "service_name": "nginx",
  "diabled": false,
  "reporter": {
    "logSpans": true,
    "localAgentHostPort": "jaeger:6831"
  },
  "sampler": {
    "type": "const",
    "param": "1"
  }
}
Configuring Open Tracing operation name
opentracing_operation_name is used to name the span everytime a span is sent out. In the above code, we have used the URI to get the naming of the span.
Testing the NGINX traces
Once we have it all together, it is time to test out the complete implementation. I have prepared a Github repository containing docker-compose file for this entire setup. This allows you to easily test out this complete implementation, makes quick changes and see the impact too. To run the code from the repository, all you need to do is:
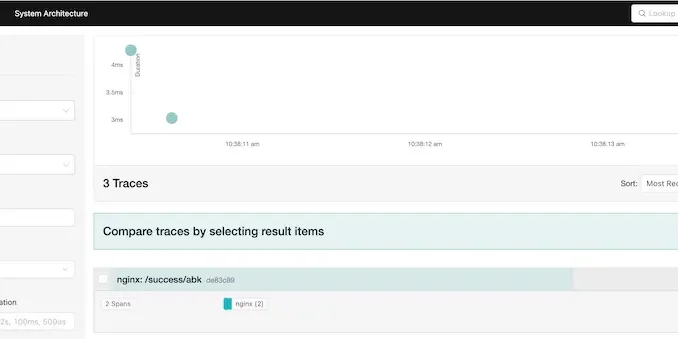
docker compose upThe python application in the code can be accessed using the URL – http://localhost:8080/success/your-name. It will return a welcome message with your name. Execute a few more request and then head over to http://localhost:16686 – This is the Jaeger UI. Select nginx in the service list and click Find Traces


