Introduction
In today’s fast-paced and dynamic digital landscape, ensuring the performance and reliability of software applications is paramount. Enter OpenTelemetry Collector, a powerful tool designed to enhance observability and streamline the monitoring process. In this article, we’ll delve into the world of OpenTelemetry Collector, exploring its key features, benefits, and how it plays a crucial role in the realm of modern application monitoring.
Understanding Observability
Observability is the ability to gain insights into the inner workings of a system by analyzing its outputs. In the context of software applications, observability involves monitoring and understanding various aspects such as performance, errors, and user interactions. OpenTelemetry Collector acts as a linchpin in achieving comprehensive observability by collecting, processing, and exporting telemetry data.
Architecture

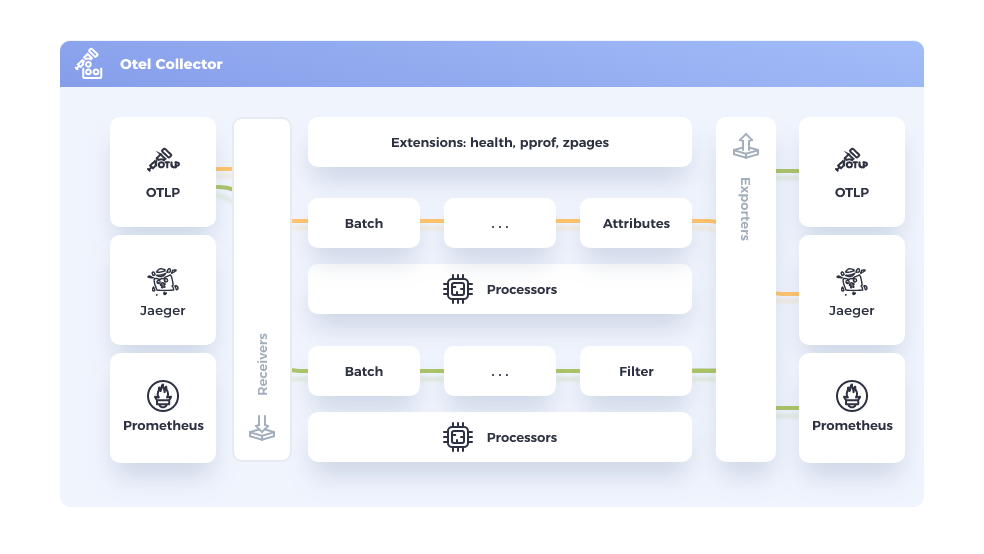
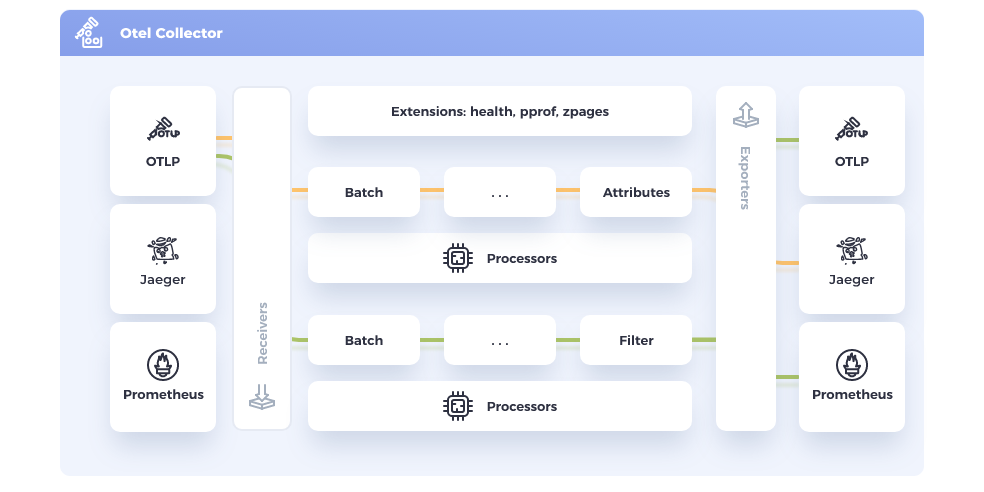
The OpenTelemetry Collector is a powerful and flexible component within the OpenTelemetry project, designed to collect, process, and export telemetry data from your applications. At a high level, its architecture consists of several key components that work together seamlessly to provide comprehensive observability. Let’s explore the high-level architecture of OpenTelemetry Collector:
- Receivers:
- At the entry point of the architecture are receivers. These components are responsible for ingesting telemetry data from various sources. Receivers support a wide range of protocols, including but not limited to HTTP, gRPC, and message queues. They act as connectors to gather data from instrumented applications and infrastructure.
- Processors:
- Once the telemetry data is received, it passes through a series of processors. Processors are responsible for performing transformations and enhancements on the data. This includes tasks such as filtering, sampling, and adding attributes or metadata to enrich the telemetry information. The flexibility of the processor architecture allows users to customize data processing based on their specific needs.
- Exporters:
- After processing, the telemetry data is sent to exporters. Exporters are responsible for transmitting the processed data to various backends or observability tools for storage, analysis, and visualization. OpenTelemetry Collector supports a variety of exporters for different observability data formats and destinations, such as Jaeger, Prometheus, Elasticsearch, and more.
- Extensions:
- Extensions are optional components that provide additional functionalities to the collector. They can be used to add features like service discovery, resource detection, or even custom enrichment of telemetry data. Extensions enhance the overall capabilities of the OpenTelemetry Collector and allow users to tailor the system to their specific requirements.
- Configuration:
- The entire architecture is driven by a configuration file. This file specifies the settings for receivers, processors, exporters, and extensions. The declarative nature of the configuration makes it easy to adapt the OpenTelemetry Collector to different use cases and deployment scenarios.
- Service Discovery (Optional):
- In some cases, the collector may utilize service discovery mechanisms to dynamically discover and adapt to changes in the environment. This is particularly useful in dynamic, containerized, or cloud-native architectures where the availability of services may change dynamically.
- Observability and Monitoring:
- The OpenTelemetry Collector itself is often instrumented to provide insights into its own performance and health. Monitoring the collector ensures that it operates effectively and allows for quick identification and resolution of any issues that may arise during data collection and processing.
By combining these components, the OpenTelemetry Collector forms a versatile and extensible observability pipeline. Its modular architecture enables users to adapt and extend its functionality to meet the specific needs of their applications and infrastructure, providing a unified and efficient way to collect and analyze telemetry data.
Key Features of OpenTelemetry Collector
- Unified Instrumentation: OpenTelemetry provides a unified set of APIs and instrumentation libraries for popular programming languages. The collector supports auto-instrumentation, making it easier to capture relevant data without manually adding code to your application.
- Pluggable Architecture: One of the standout features of OpenTelemetry Collector is its pluggable architecture. It supports various instrumentation and storage plugins, allowing users to tailor their observability stack to meet specific requirements. Whether you’re using Prometheus, Jaeger, or other telemetry data sources, the collector seamlessly integrates with them.
- Data Transformation and Normalization: The collector plays a crucial role in transforming and normalizing data from diverse sources. It consolidates information from various instrumented components, ensuring a consistent format that can be easily consumed by downstream observability tools.
- Smart Sampling: OpenTelemetry Collector incorporates intelligent sampling mechanisms, preventing information overload by selectively collecting data. This ensures that only relevant and valuable telemetry data is sent for further analysis, optimizing resource utilization.
- Performance and Scalability: Designed with scalability in mind, the collector efficiently handles large volumes of telemetry data. Its performance optimizations make it suitable for deployment in diverse environments, from small-scale applications to large, distributed systems.
Benefits of OpenTelemetry Collector
- Simplified Integration: OpenTelemetry Collector simplifies the integration of observability tools into your existing infrastructure. Its compatibility with various instrumentation libraries and data sources reduces the complexity of setting up and maintaining a robust monitoring system.
- Enhanced Troubleshooting: By providing a comprehensive view of your application’s performance, the collector facilitates quick and effective troubleshooting. Developers and operators can pinpoint issues, analyze root causes, and make informed decisions to improve overall system reliability.
- Interoperability: The collector promotes interoperability across different observability tools and ecosystems. This flexibility enables organizations to choose the best-of-breed solutions for their specific needs, fostering a diverse and adaptable monitoring environment.
- Future-Proofing: As an open-source project, OpenTelemetry benefits from a vibrant community that continually contributes to its development. Adopting OpenTelemetry Collector ensures that your observability stack remains relevant and adaptable to evolving industry standards and technologies.
Conclusion
OpenTelemetry Collector stands at the forefront of the observability revolution, empowering organizations to gain valuable insights into their applications’ performance and health. Its pluggable architecture, smart sampling, and seamless integration capabilities make it a valuable asset in the quest for a more observable and resilient software ecosystem. By incorporating OpenTelemetry Collector into your monitoring toolkit, you pave the way for a future-proof and efficient observability strategy.


