AI Incident Triage: A Co-Pilot for the First 10 Minutes
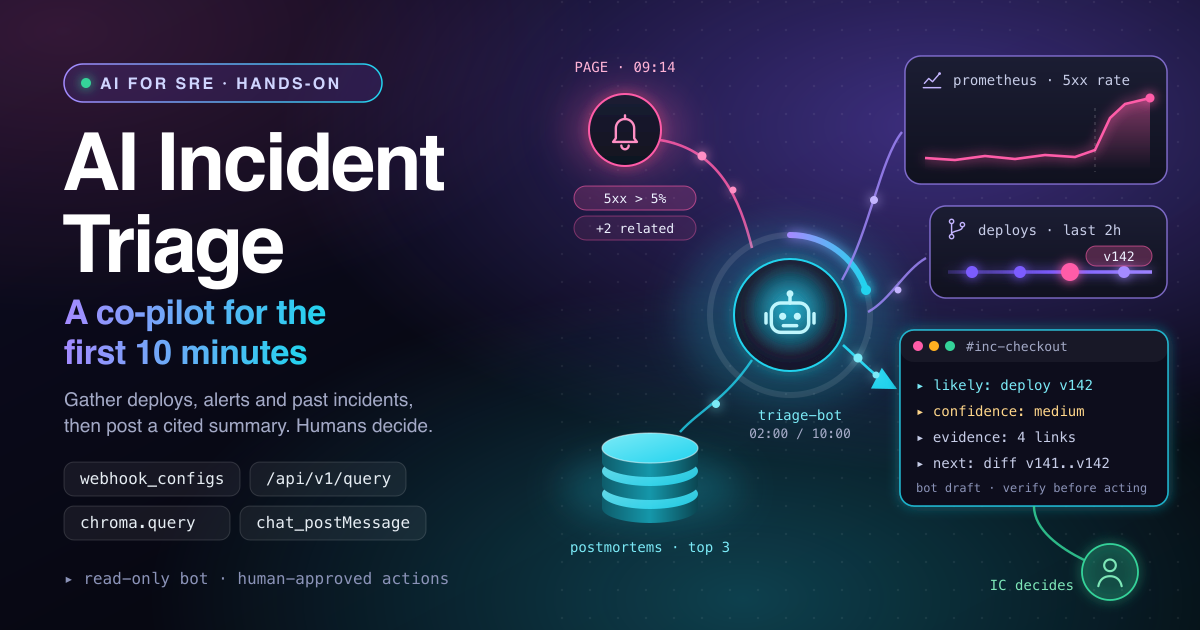
The first ten minutes of a page go on gathering facts: what shipped, what else is red, and whether this has happened before. AI incident triage hands that legwork to a bot. In this guide you will wire Alertmanager to a small Python worker that queries Prometheus, a deploy log and a RAG index of post-mortems, then posts a cited summary to the incident channel without touching production.
How AI incident triage works
Triage answers three questions fast: what is broken, what changed, and have we seen this before? The bot gathers evidence while the human is being paged, asks a large language model (LLM) to organise it, and posts the result in the incident channel. The sequence diagram shows one page from start to finish.
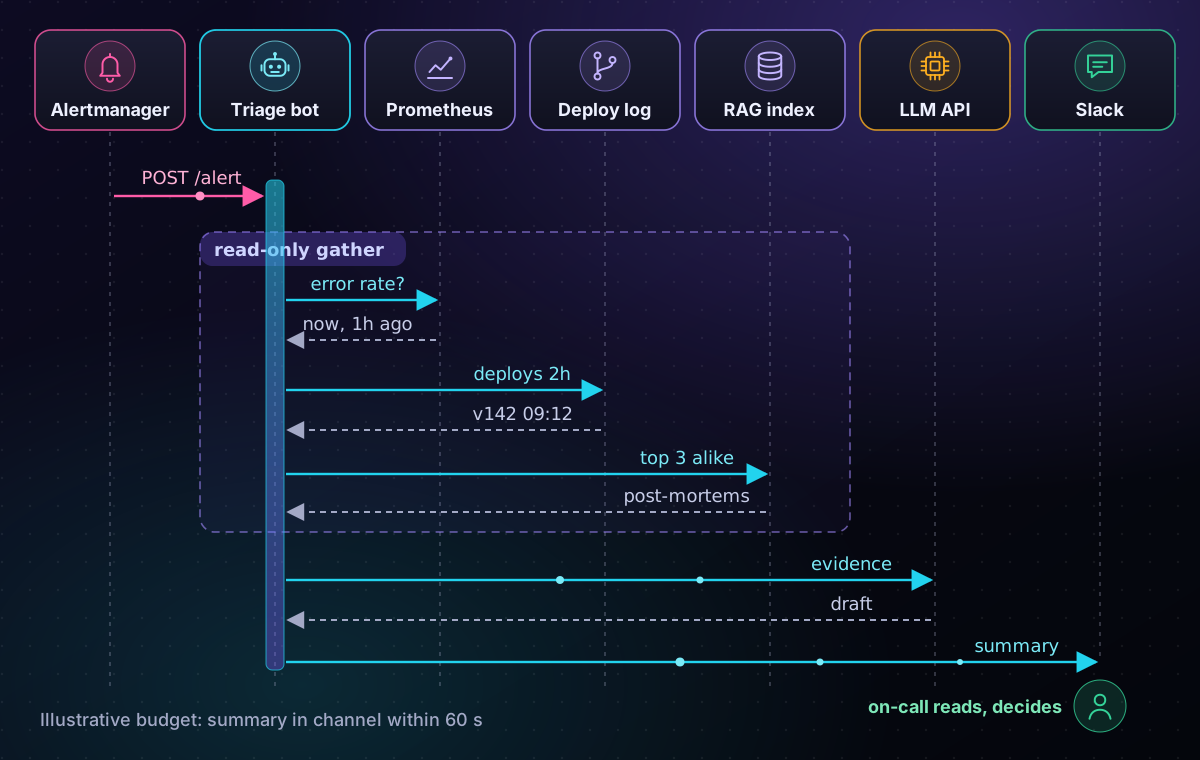
The page still goes straight to a human, because the bot is only a second receiver: a broken bot never delays a page. Every call inside the frame is a read, and the bot's only write is one chat message.
You need Alertmanager, Prometheus, Python 3.9 or newer, an Anthropic API key, a Slack bot token with the chat:write scope, and a Chroma index of past post-mortems. The RAG 101 guide has the ingest script: point it at your post-mortem folder and name the collection postmortems.
Step 1: Send every page to the triage worker
Alertmanager already knows when a page fires, so let it tell the bot too. Add a webhook to the receiver that already pages on-call, rather than creating a new route, and the human is paged exactly as before.
# alertmanager.yml: the receiver that already pages on-call
receivers:
  - name: oncall-page
    # your existing pagerduty_configs / opsgenie_configs stay unchanged
    webhook_configs:
      - url: http://triage-bot.sre.svc:8080/alert
        send_resolved: false  # triage new pages only
        max_alerts: 5         # cap alerts per notification
        timeout: 10s          # never hold up notifications
Alertmanager POSTs a JSON body to that URL on every notification. Each alert in its alerts array carries labels, annotations and a generatorURL that links back to the rule's expression. Alerts beyond five are dropped and counted in truncatedAlerts.
Check the file with amtool check-config alertmanager.yml, which should report SUCCESS, then reload Alertmanager. The classic mistake is giving the webhook its own route without continue: true. Only the first matching route fires, so the bot quietly steals pages from the human.
Step 2: Gather the evidence, no AI yet
The first half of the worker is plain data collection: deterministic, unit-testable, and the model only ever sees facts you chose. The data-flow diagram shows what the worker reads and where its output goes.
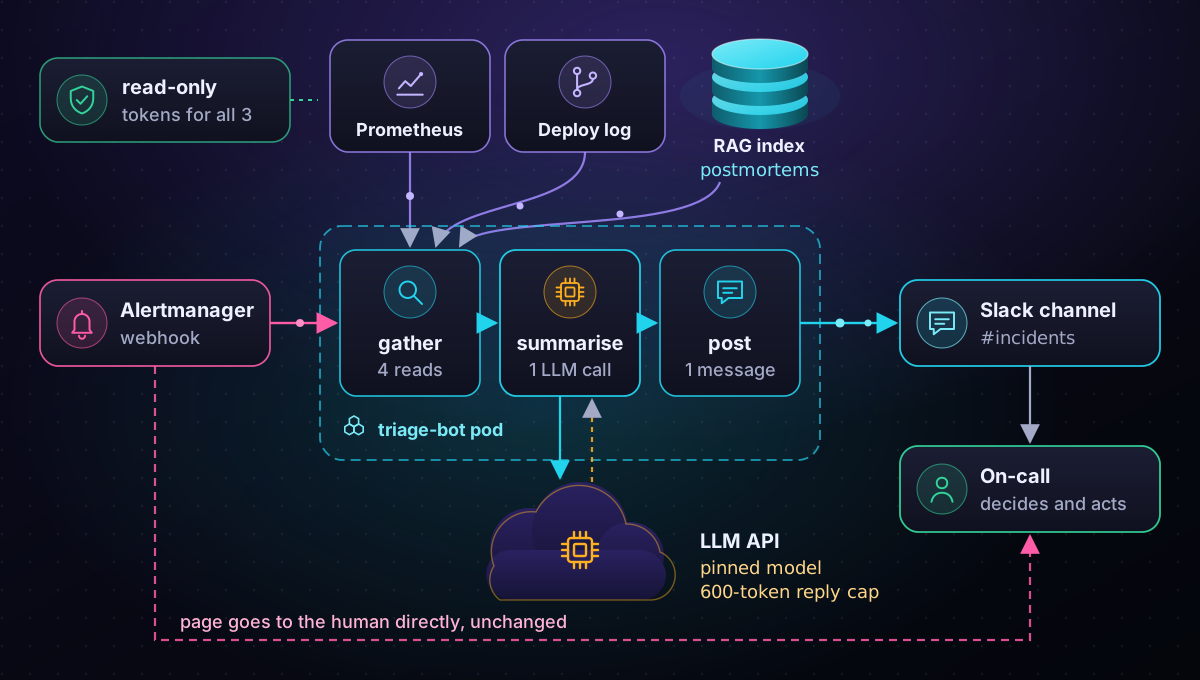
Every source sits behind a read-only token, and only the LLM call leaves your network. Save the code below as triage.py. It assumes the common http_requests_total counter with service and code labels, and an endpoint that returns recent deploys as JSON, such as a thin wrapper over your CD tool's history.
import os, requests, chromadb

PROM = os.environ["PROM_URL"]           # Prometheus base URL
DEPLOYS = os.environ["DEPLOY_LOG_URL"]  # returns recent deploys as JSON
INDEX = chromadb.PersistentClient(path=".chroma").get_collection(name="postmortems")
ERRORS = 'sum(rate(http_requests_total%s[5m]%s))'

def prom(path, **params):
    r = requests.get(PROM + path, params=params, timeout=5)
    r.raise_for_status()
    return r.json()["data"]

def gather(alert):
    svc = alert["labels"].get("service", "unknown")
    sel = '{service="%s",code=~"5.."}' % svc
    q = lambda off: prom("/api/v1/query", query=ERRORS % (sel, off))["result"]
    return {
        "alert": {**alert["labels"], **alert["annotations"], "link": alert["generatorURL"]},
        "errors_now": q(""),
        "errors_1h_ago": q(" offset 1h"),  # offset must sit inside rate()
        "related": [a["labels"] for a in prom("/api/v1/alerts")["alerts"]
                    if a["state"] == "firing"][:10],
        "deploys": requests.get(DEPLOYS, params={"service": svc, "hours": 2}, timeout=5).json(),
        "similar": INDEX.query(query_texts=[alert["annotations"].get("summary", svc)], n_results=3),
    }
prom() wraps the Prometheus HTTP API, and the five-second timeouts stop one slow backend from stalling triage. The error query runs twice, now and an hour ago, so the model sees a spike instead of guessing at one.
Related alerts are capped at ten, and the alert's summary becomes the search text for similar post-mortems. The usual failure is a label mismatch: if your metric uses job instead of service, both error lists come back as []. Paste the query into the Prometheus UI first and confirm it returns one series.
Step 3: Summarise with an LLM and post it
Now the model turns raw evidence into something a tired engineer can read in twenty seconds. The system prompt fixes the format and demands a confidence level and a link for every claim. Install the libraries with pip install requests chromadb anthropic slack-sdk, then append this to triage.py:
import json, threading, anthropic
from http.server import BaseHTTPRequestHandler, HTTPServer
from slack_sdk import WebClient

MODEL = os.environ.get("TRIAGE_MODEL", "claude-sonnet-5-5")  # pin it
SYSTEM = ("Triage this page from the JSON evidence only. Give: likely cause, confidence "
          "(low/medium/high), evidence with one link per claim, next checks for a human. "
          "If evidence is thin, say Unknown. Never suggest changing production.")

def triage(alert):
    evidence = json.dumps(gather(alert), default=str)[:30000]  # input budget
    reply = anthropic.Anthropic().messages.create(model=MODEL, max_tokens=600, system=SYSTEM,
                                                  messages=[{"role": "user", "content": evidence}])
    u = reply.usage
    WebClient(token=os.environ["SLACK_BOT_TOKEN"]).chat_postMessage(
        channel=os.environ["TRIAGE_CHANNEL"],
        text=f"{reply.content[0].text}\n{MODEL} · {u.input_tokens}/{u.output_tokens} tokens · bot draft")

class Hook(BaseHTTPRequestHandler):
    def do_POST(self):
        body = json.loads(self.rfile.read(int(self.headers["Content-Length"])))
        self.send_response(202)  # answer first: Alertmanager must not wait
        self.end_headers()
        for alert in body["alerts"]:
            threading.Thread(target=triage, args=(alert,)).start()

HTTPServer(("", 8080), Hook).serve_forever()
The [:30000] slice is a crude cap on input tokens, and max_tokens=600 caps the reply. The footer logs the model and token counts on every post, so cost per page is visible from day one. The handler answers 202 before any work starts, so Alertmanager never waits.
One catch: if triage() raises, the thread dies silently. Catch it and post "triage failed", so silence never reads as "nothing found".
Step 4: Test it and read the triage summary
You do not need an outage to test it. Export the five environment variables, run python3 triage.py, then send a fake page from a second terminal:
curl -i -X POST http://localhost:8080/alert -H 'Content-Type: application/json' \
  -d '{"alerts": [{"labels": {"alertname": "CheckoutHighErrorRate", "service": "checkout"},
       "annotations": {"summary": "checkout 5xx above 5%"},
       "generatorURL": "http://prometheus:9090/graph"}]}'
Expect HTTP/1.0 202 Accepted at once, then, seconds later, a message like this in the channel. The numbers are illustrative.
Likely cause: deploy checkout v142 at 09:12, two minutes before 5xx began
Confidence: medium
Evidence:
- 5xx 0.4/s an hour ago, 12.1/s now: http://prometheus:9090/graph?...
- v142 "raise DB pool timeout": https://deploys.internal/checkout/142
- similar: postmortems/2026-03-checkout-pool.md
Next checks for a human:
1. Diff the v142 config against v141
claude-sonnet-5-5 · 6120/212 tokens · bot draft
The likely cause is a hypothesis, and "medium" is honest: the timing fits, but nothing proves causation yet. Each evidence line links to its source, so the incident commander (IC) can verify it in seconds. Treat any unlinked claim as invented.
Before relying on it, replay 20 past pages with Slack switched off and score each summary against its post-mortem. Re-run that eval whenever the model, prompt or index changes.
What the AI must never do on its own
A triage bot earns trust by being boring: it reads freely, but any step that changes production reaches a human as a proposal. The flowchart applies that rule to every step the bot might take.
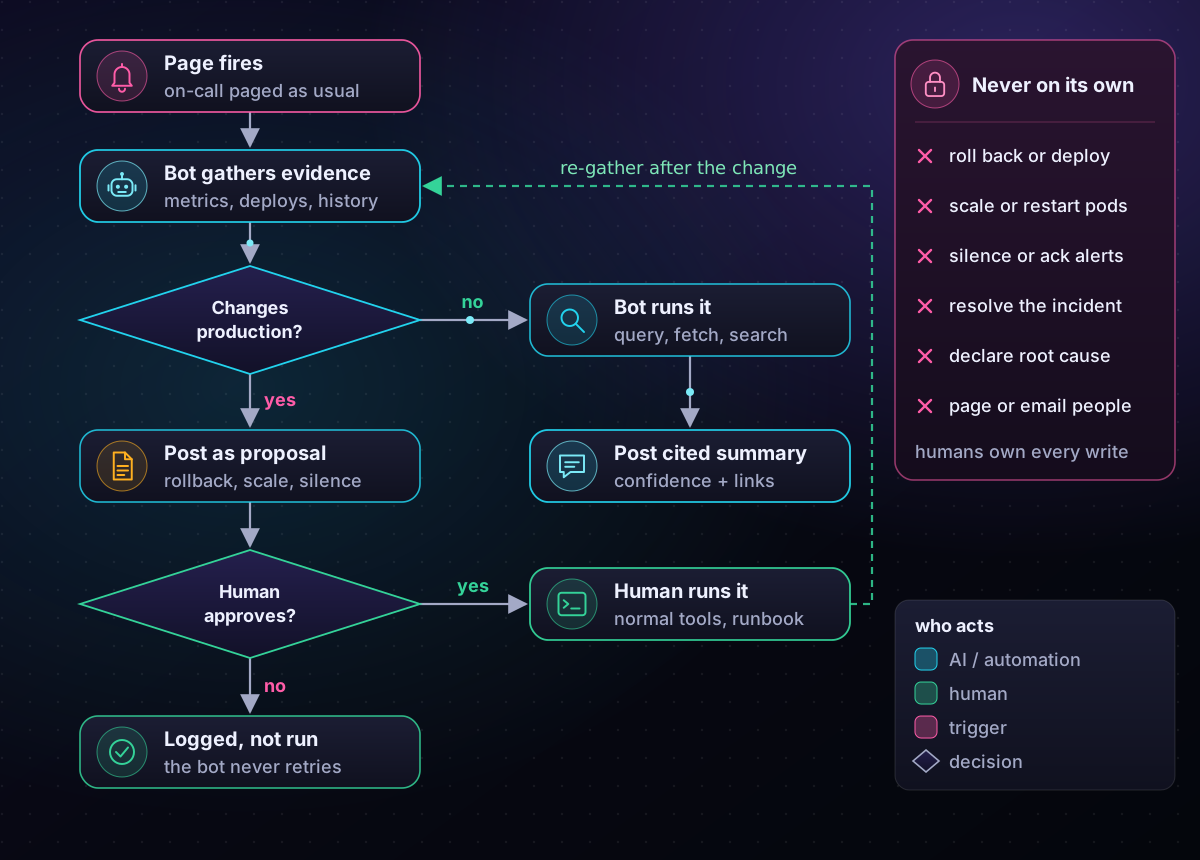
The cyan path runs unattended. Once a step would change state, it becomes a proposal and the IC decides. On its own, the bot must never roll back, deploy, scale or restart anything; silence, acknowledge or resolve alerts; declare a root cause; or page people and message customers.
I use the same split in the Slack bot I built to investigate incidents with documentation search, metric plugins and log APIs. Automated fixes can come later, with guardrails like those on my automated upgrades for a 2000+ machine fleet: change limits, host draining and a kill switch. A quiet bot also helps keep on-call sustainable.
Common pitfalls
- Bot in the paging path. If the page waits for the bot, every bot outage becomes a paging outage.
- Prompt stuffing. Raw logs raise cost and latency and bury the signal. Send rates, counts and links.
- Unpinned models. A silent model change shifts triage quality overnight. Pin the ID, version the prompt, re-run evals.
Key takeaways
- AI incident triage is fast evidence gathering, not decision making.
- Run the bot beside the page, never in front of it.
- Keep gathering deterministic, and demand confidence plus a link for every claim.
- The bot reads and proposes; humans approve every change to production.
Related articles
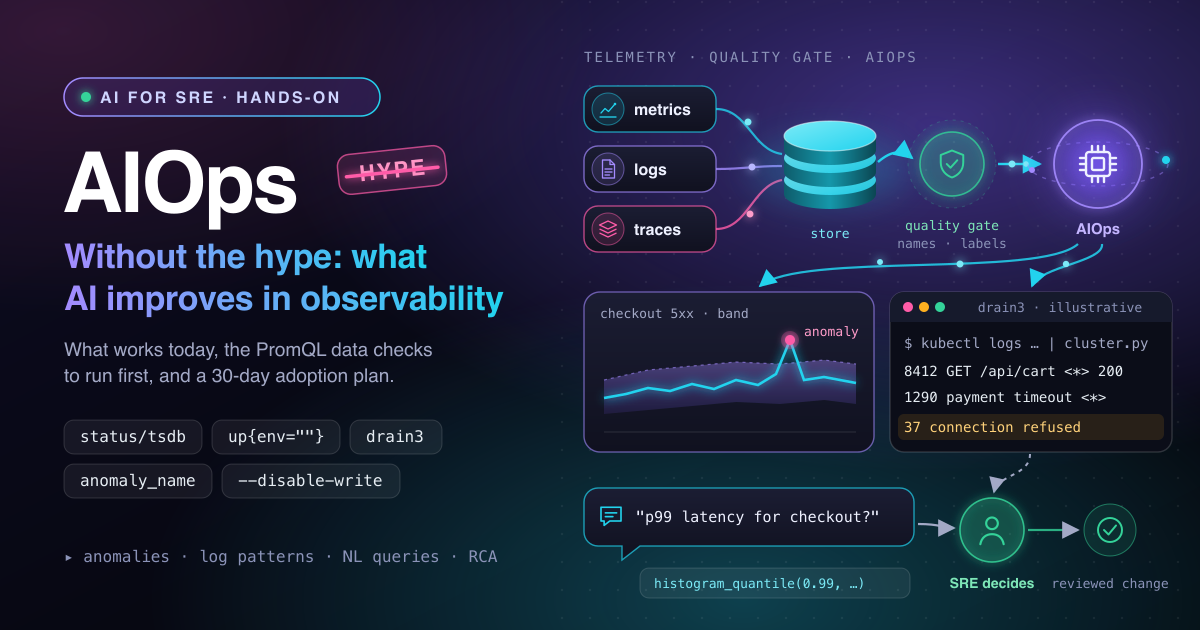
AIOps Without the Hype: What AI Improves in Observability
Anomaly detection, log clustering, natural-language queries and autonomous RCA: which AIOps features work today, the data quality they need, and how an SRE team can adopt them in 30 days.
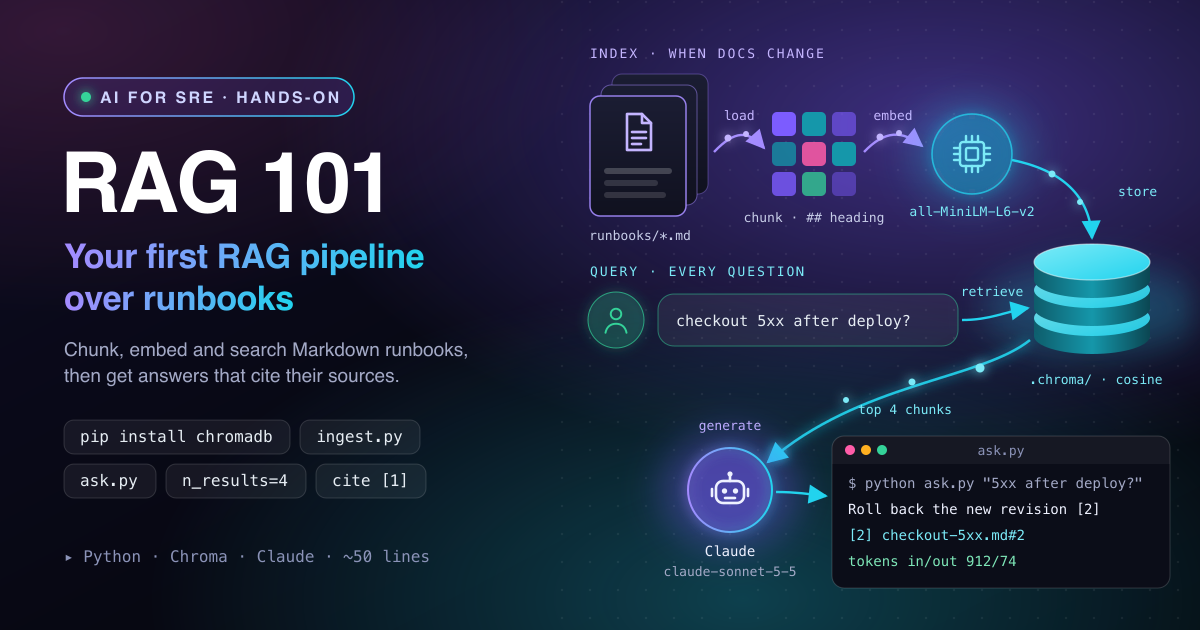
RAG 101: Build Your First RAG Pipeline over Runbooks
Turn a folder of Markdown runbooks into an on-call assistant: chunk by heading, embed locally with Chroma, answer with Claude, cite every source, and refuse when no runbook matches.
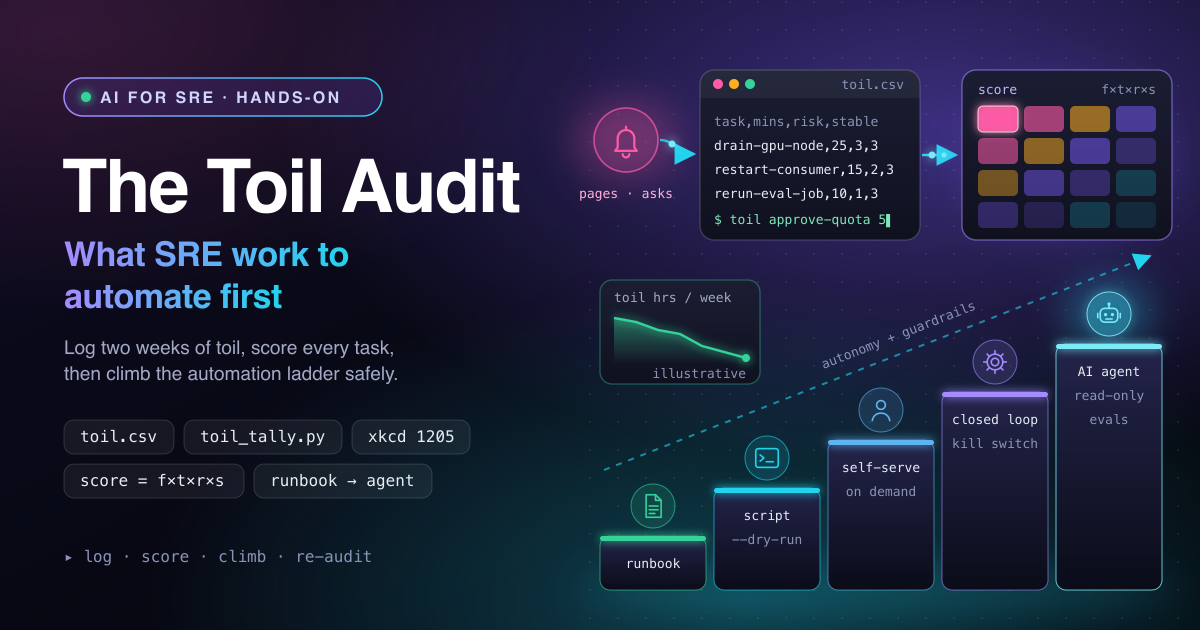
The Toil Audit: What SRE Work to Automate First
Stop guessing which toil to kill. Log two weeks of SRE toil, score each task by frequency, time, risk and stability, and climb the automation ladder from runbook to AI agent.