AIOps Without the Hype: What AI Improves in Observability
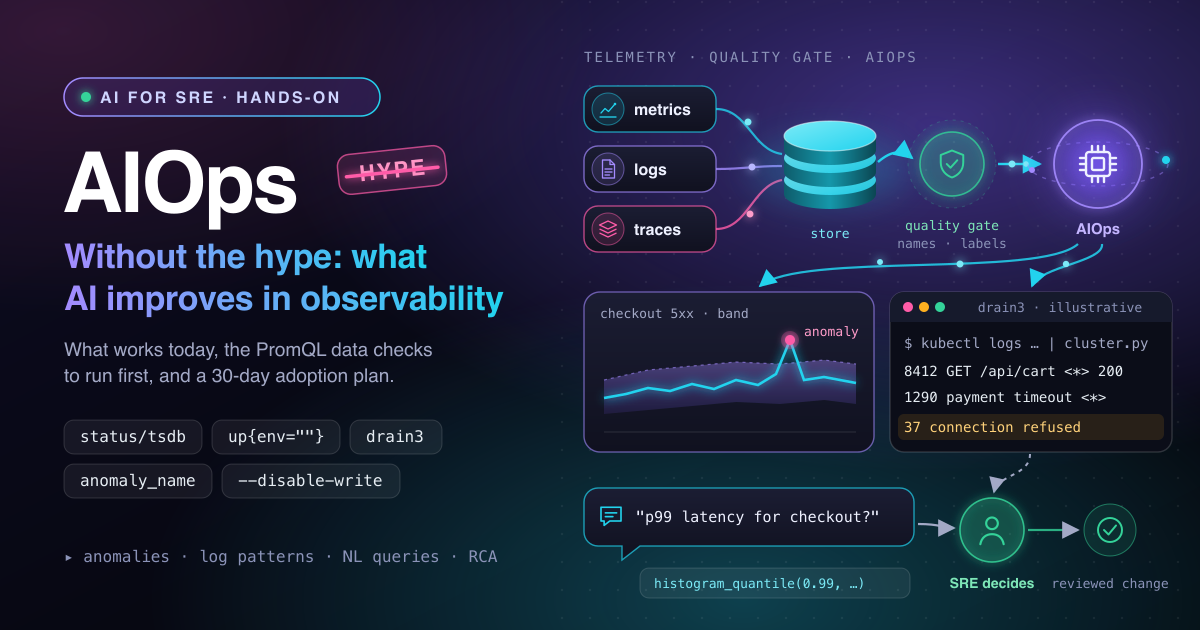
Every observability vendor now sells AIOps, and most SRE teams can't tell which parts will actually shorten an incident. This post separates what works today from what is still a demo. You will run cardinality and naming checks against Prometheus, try log clustering yourself, and leave with a 30-day plan to adopt AI features without losing on-call trust.
How AIOps fits into an observability stack
AIOps (AI for IT operations) is the umbrella term for machine-learning and LLM features that sit on top of your telemetry. They never look at your systems directly. They read metrics, logs and traces after those have been collected, labelled and stored, so they can only be as good as that data.
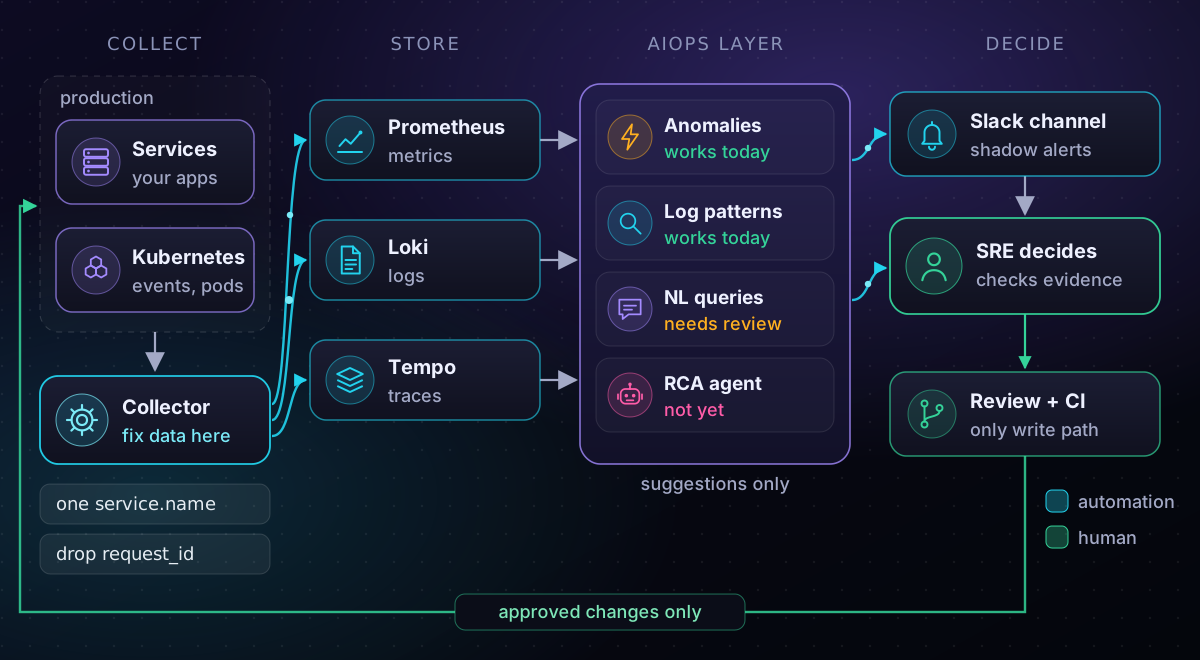
Notice two things. The Collector is the cheapest place to fix data quality: rename a service there and every downstream tool sees the fix. And the path back to production runs through a person and code review. Every capability here produces a suggestion (an anomaly, a pattern, a query), and none should change production on its own.
You need a Prometheus server, curl, jq, kubectl and Python 3. New to the three signals? Start with the beginner's guide to observability and observability vs monitoring.
AIOps today: what works and what is still a demo
Vendors bundle four very different capabilities under one name, so judge each on its own. The matrix rates them as of November 2026 and lists what each needs from you before it pays off.
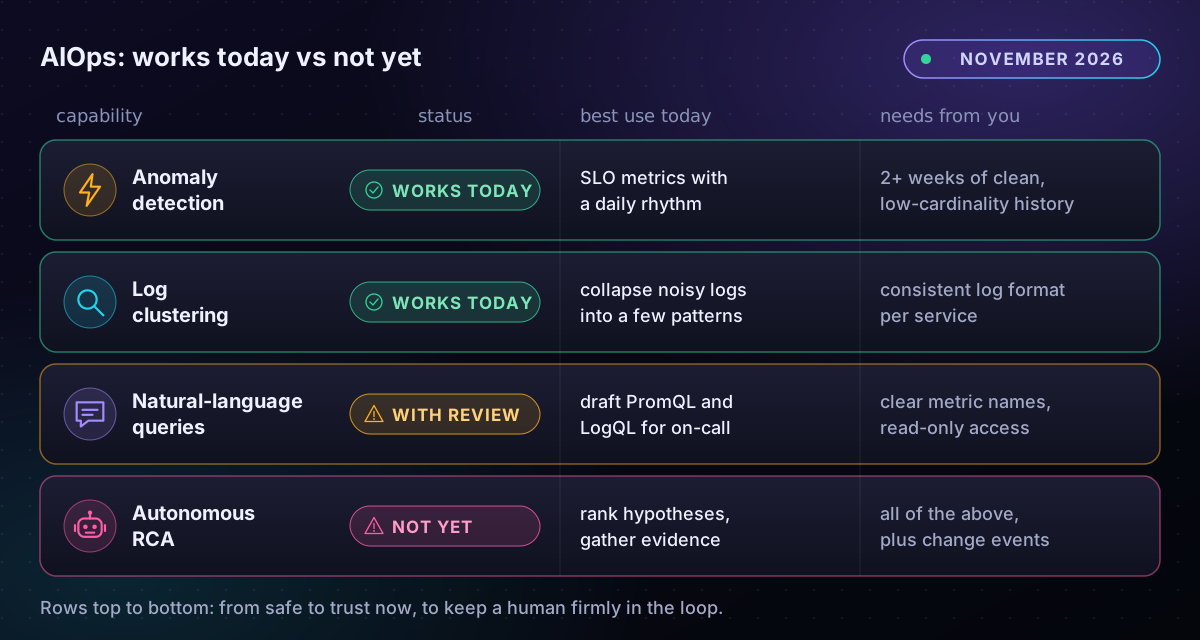
- Anomaly detection works for a narrow job: flagging when a well-understood metric, such as checkout error rate, leaves its usual daily shape. It fails on sparse or brand-new series, where "usual" is undefined.
- Log clustering is the quiet winner. Algorithms such as Drain group lines into templates, so thousands of lines collapse into a handful of patterns you can read in a minute.
- Natural-language queries are good at drafting PromQL or LogQL for people who rarely write it. Read each generated query before you trust its graph.
- Autonomous root-cause analysis (RCA) is not there yet. Agents gather evidence and rank hypotheses well, but still confuse correlation with cause in failures they have never seen.
The Slack bot I built to investigate incidents, using documentation search, metric plugins and log APIs, follows the same split: it gathers and cites evidence, and the on-call engineer decides.
Data-quality prerequisites nobody mentions
Every AIOps feature groups and baselines by labels. If one service reports as checkout in metrics, checkout-svc in logs and shop-checkout in traces, no model will join them for you. High cardinality, meaning a label with a huge number of distinct values such as a request ID, makes baselines noisy and bills large.
Find your cardinality hot spots
Prometheus reports its own cardinality through the TSDB status API. This call returns the metrics with the most series and the labels with the most distinct values, which is where baselines break first.
# Top 5 metrics by series count, and labels with the most distinct values
curl -s 'http://localhost:9090/api/v1/status/tsdb?limit=5' \
  | jq '{series: .data.headStats.numSeries,
         metrics: [.data.seriesCountByMetricName[] | "\(.name)=\(.value)"],
         labels: [.data.labelValueCountByLabelName[] | "\(.name)=\(.value)"]}'
limit=5 caps each list (the default is 10), and numSeries counts the active series held in memory. Expect something like this (illustrative numbers):
{
  "series": 1843210,
  "metrics": ["http_server_duration_seconds_bucket=412880", "..."],
  "labels": ["request_id=96211", "url_path=18342", "pod=2210"]
}
A label like request_id with tens of thousands of values is the red flag: each value is a separate series a detector must baseline. Drop or aggregate it in the OpenTelemetry Collector. Trimming labels that way, with the Collector and vector.dev, is how I cut one metrics bill by up to 50%. A 404 usually means you are querying a Prometheus-compatible store; use its own cardinality tooling instead.
Check labels and service names with PromQL
Next, check that the labels an AIOps tool will group by are present and consistent. Run these one at a time in the Prometheus or Grafana query editor, swapping in your own label and service names.
# a) Jobs whose targets have no env label (empty matcher = label absent)
count by (job) (up{env=""})

# b) One service, several spellings?
group by (job) (up{job=~"(?i).*checkout.*"})

# c) OTLP services: one target_info series per resource
count by (job) (target_info)
Query (a) relies on a PromQL rule: env="" also matches series that lack the label, so it lists every job you cannot split by environment. Query (b) uses a case-insensitive regex to surface spellings that should be one service:
{job="checkout"}         1
{job="checkout-svc"}     1
{job="shop/checkout"}    1
Three names means three thin baselines instead of one solid one. Pick one name per service, following the OpenTelemetry service.name convention, and enforce it with the Collector's resource or transform processor. For query (c), the Prometheus OTLP receiver builds job from service.namespace/service.name, so the list should match the services in your traces. The usual trap: (b) only finds spellings you thought of, so also skim /api/v1/label/job/values.
Try log clustering yourself in ten minutes
Log clustering is the easiest capability to test without buying anything. Drain3 is an open-source Python implementation of the Drain algorithm. It reads lines one at a time, groups similar ones into templates and replaces the parts that vary with <*>. Run pip install drain3, then save this as cluster.py:
# cluster.py: group log lines from stdin into templates, biggest first
import sys
from drain3 import TemplateMiner

miner = TemplateMiner()            # no drain3.ini: default settings, no masking
for line in sys.stdin:
    miner.add_log_message(line.strip())

top = sorted(miner.drain.clusters, key=lambda c: c.size, reverse=True)
for c in top[:5]:
    print(f"{c.size:>6}  {c.get_template()}")
add_log_message either adds a line to an existing cluster or starts a new one, and c.size counts the lines in each. Pipe an hour of one pod's logs through it (illustrative counts):
kubectl logs deployment/checkout -n shop --since=1h | python3 cluster.py
#   8412  GET /api/cart <*> 200 <*>
#   1290  payment provider timeout after <*> retrying
#     37  dial tcp <*> connect: connection refused
The rare clusters at the bottom are often the interesting ones: 37 refused connections hide easily among 8,000 healthy requests. A config file not found: drain3.ini warning is harmless; that file holds masking rules so IPs and IDs don't split one pattern into many. In production, Loki's pattern ingester powers the same idea in Grafana Logs Drilldown.
A 30-day AIOps adoption plan for an SRE team
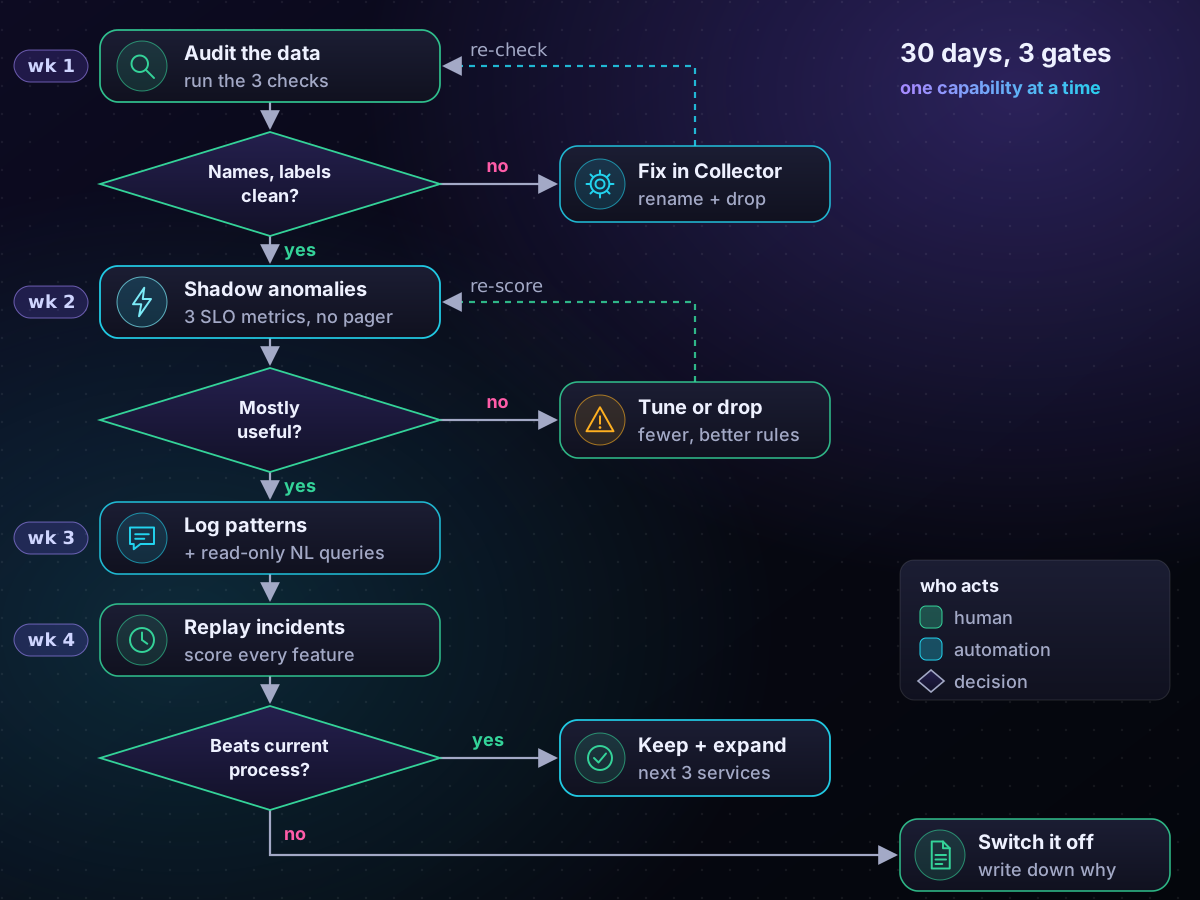
The plan adopts one capability at a time, in order of maturity, with a gate between steps. The flowchart shows those gates. A failed check sends you back to fix the data or the rules, never to "train the model harder".
Week 1: audit and fix the data
Pick three services that already have SLOs. Run the checks above, agree on one name per service, and fix names and runaway labels in the Collector. You are done when each service has one name across metrics, logs and traces.
Week 2: anomaly detection in shadow mode
Enable detection on those services' SLO metrics only, such as error rate and p99 latency. On plain Prometheus, Grafana's open-source promql-anomaly-detection rules build mean and standard-deviation bands; you opt a metric in with an anomaly_name label. Send alerts to a Slack channel, not the pager, and mark each one useful or noise.
Week 3: log patterns and natural-language queries
Give on-call the Patterns view (Loki needs --pattern-ingester.enabled=true) and a read-only assistant. The open-source mcp-grafana server, started with --disable-write, lets an LLM client run PromQL and LogQL without write tools. Log the model, prompt version, tokens and latency of every question.
Week 4: replay incidents and decide
Replay three recent incidents as an eval set. Did an anomaly fire before the page? Did the top pattern point at the cause? Did generated queries run unedited? Keep what beat your current process; switch off the rest. If the assistant lacks runbook context, add retrieval as in RAG 101.
Common pitfalls
- Buying before auditing. No model can merge three names for one service.
- Paging on day one. A noisy week costs more on-call trust than the feature earns; start in shadow mode.
- Calling a hypothesis a root cause. Agents rank hypotheses; people confirm causes in the post-mortem.
- No budget for the assistant itself. Track cost per question and latency against an SLO, like any other dependency.
Key takeaways
- AIOps is capped by data quality: fix service names, labels and cardinality first.
- Log clustering and SLO-scoped anomaly detection work today; autonomous RCA does not yet.
- Run each new capability in shadow mode and score it against real incidents.
- Treat assistants as production services: read-only access, versioned prompts, a token budget.
Related articles
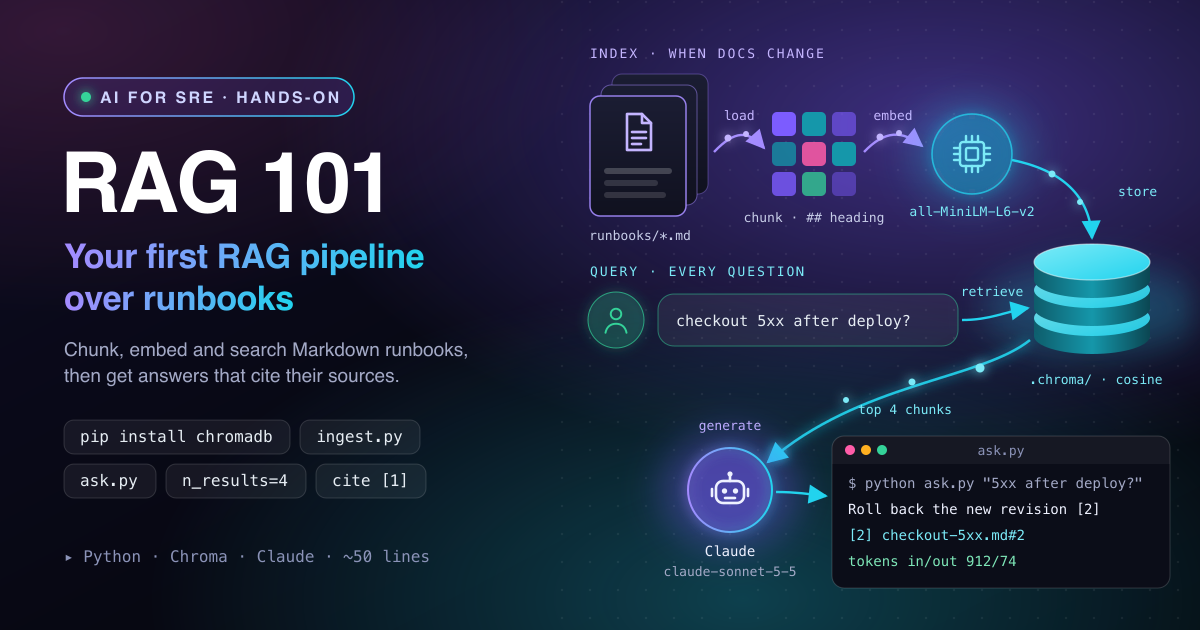
RAG 101: Build Your First RAG Pipeline over Runbooks
Turn a folder of Markdown runbooks into an on-call assistant: chunk by heading, embed locally with Chroma, answer with Claude, cite every source, and refuse when no runbook matches.
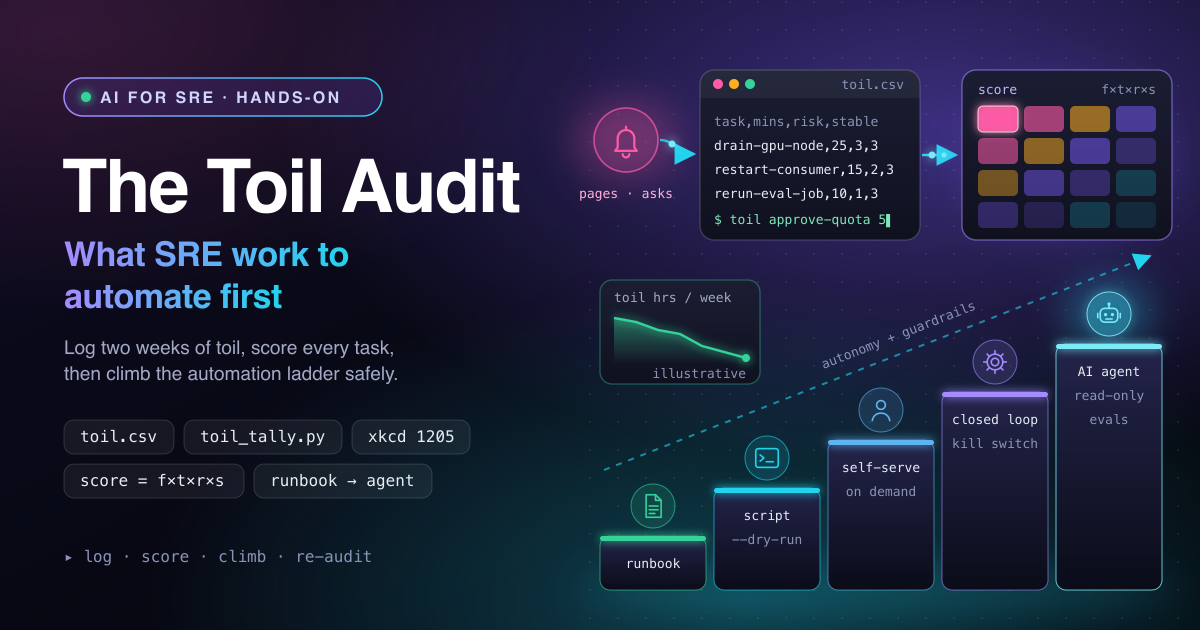
The Toil Audit: What SRE Work to Automate First
Stop guessing which toil to kill. Log two weeks of SRE toil, score each task by frequency, time, risk and stability, and climb the automation ladder from runbook to AI agent.
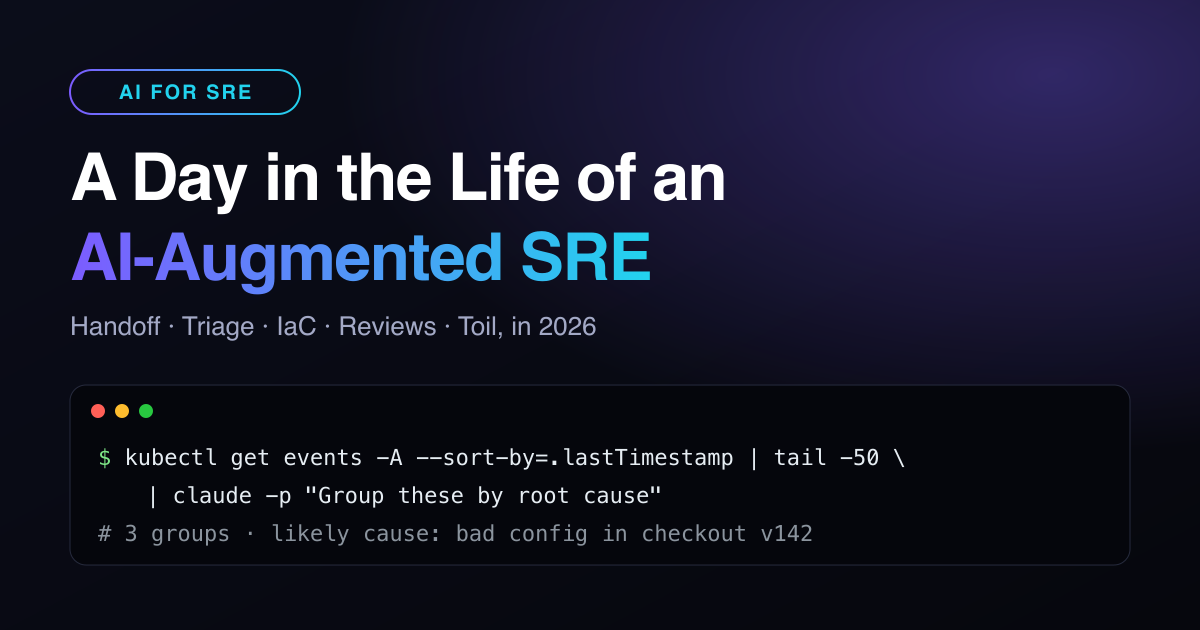
A Day in the Life of an AI-Augmented SRE (2026)
What actually changes when SREs work with AI every day: handoffs, triage, Terraform changes and reviews, block by block, with the commands that do the heavy lifting.